
What are the indicators for Trading?
A set of tools called indicators is used on a trading chart to assist make the market more understandable.
An asset may be overbought or oversold in a range and due for a reversal, for example, according to an indicator, which can also provide specific market information.
For example, they can confirm if the market is trending or range.
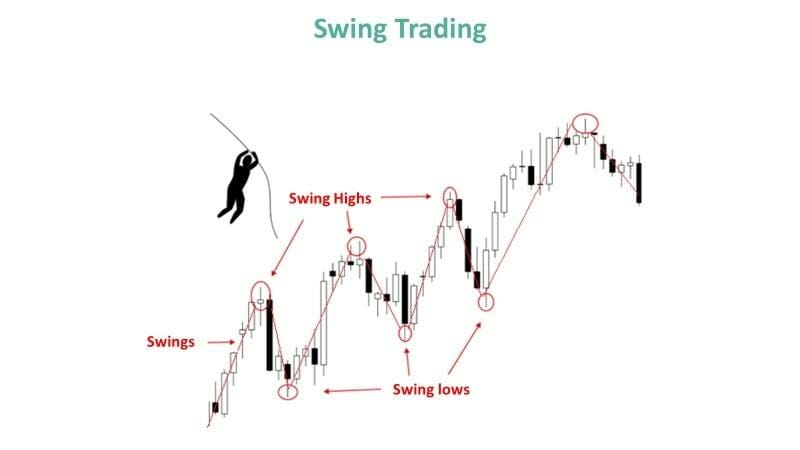
Traders will be looking for two swings:-
- Swing highs:(Bullish Swings) – When a market reaches a peak before backtracking, a short trade is possible.
- Swing lows🙁Bearish Swings) – When a market reaches a bottom and then recovers, offering a chance for a long trade.


Six highly reliable Swing Trading Indicators
- Moving Averages (MA)
- Relative Strength Index (RSI)
- Moving Average Convergence Divergence (MACD)
- Bollinger Bands
- Stochastic Oscillator
- Average True Range (ATR)
Moving Averages (MA)
- Moving averages (MAs) determine the average price movement of a market over a specified time period.
- They eliminate any inconsistent short-term surges by doing this.
- The reason MAs are referred to as trailing indicators is that they examine previous market activity.
- A moving average lag more the longer the time it covers.
- MAs are typically employed as lagging indicators to confirm trends rather than forecast them.
- Depending on how many time periods an MA analyses, it is classified as short-, medium-, or long-term: Short-term MAs range from 5 to 50 periods, medium-term MAs range from 50 to 100 periods, and long-term MAs range from 100 to 200 periods.


They are primarily of two types:
- Simple moving averages (SMAs) average all of the closing prices for the specified period.
- Price activity that is closer to the present date is given more weight by exponential moving averages (EMAs).
Relative Strength Index (RSI)
- Swing traders frequently use momentum indicators because they show potential fluctuations within a larger trend.
- The relative strength index (RSI), which indicates if a market is overbought or oversold and, thus, whether a swing might be imminent, is perhaps the most frequently used example.
- The RSI calculates a market’s positive and negative closes over a predetermined number of times, often 14 periods.
- It is shown as an oscillator, which is a chart that oscillates between zero and one hundred.
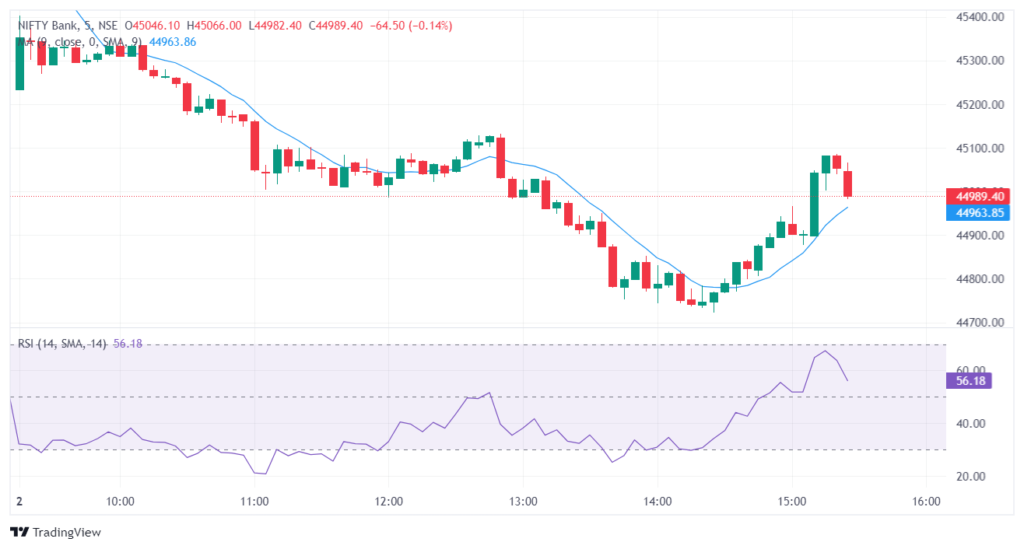

- It is generally accepted that anything above 70 is overbought, which can be an indication to start a short position.
- Meanwhile, the RSI is often considered to be in oversold territory when it falls below 30. This is frequently seen as a cue to go long.
- A market may be set to enter a bear market if, for example, an uptrend is present but the RSI rises above 70. However, if its RSI stays low, the trend might be expected to continue.


Moving Average Convergence Divergence (MACD)
- Moving Average Convergence Divergence, or MACD, is a well-liked momentum indicator that traders use to spot future trends, changes in momentum, and trade signals.
- The MACD indicator, created by Gerald Appel, is calculated using two EMAs of the asset’s price.
- The 12-day and 26-day EMAs, as well as a 9-day EMA for the signal line, are the default settings for MACD.
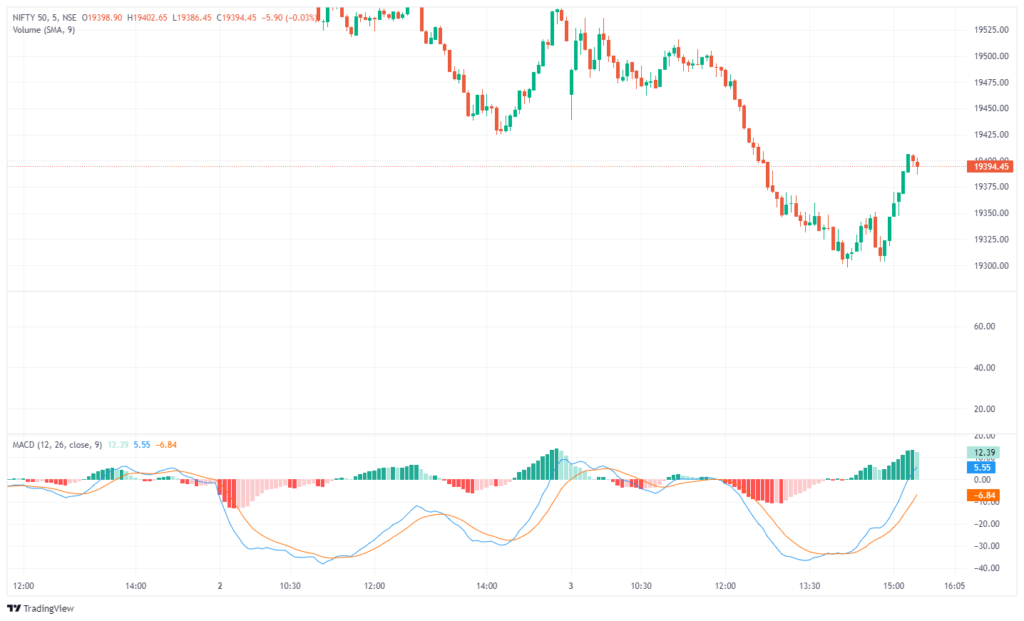

- When the MACD line crosses above the signal line, signalling a prospective upswing, it generates a positive signal.
- A bearish signal, on the other hand, is generated when the MACD line crosses below the signal line and denotes a prospective downtrend.
- Divergence: A trend reversal may occur when the price hits lower lows while the MACD produces higher lows. This is known as bullish divergence.
- When the price establishes higher highs but the MACD creates lower highs, this is known as bearish divergence and it indicates that the trend may be changing.
- Trading professionals also check for extreme MACD histogram readings to identify overbought and oversold conditions. While big negative values might signify an oversold situation, huge positive values might represent an overbought situation.


Bollinger Bands
- A popular technical analysis tool used by traders and investors in the financial markets is the Bollinger Band.
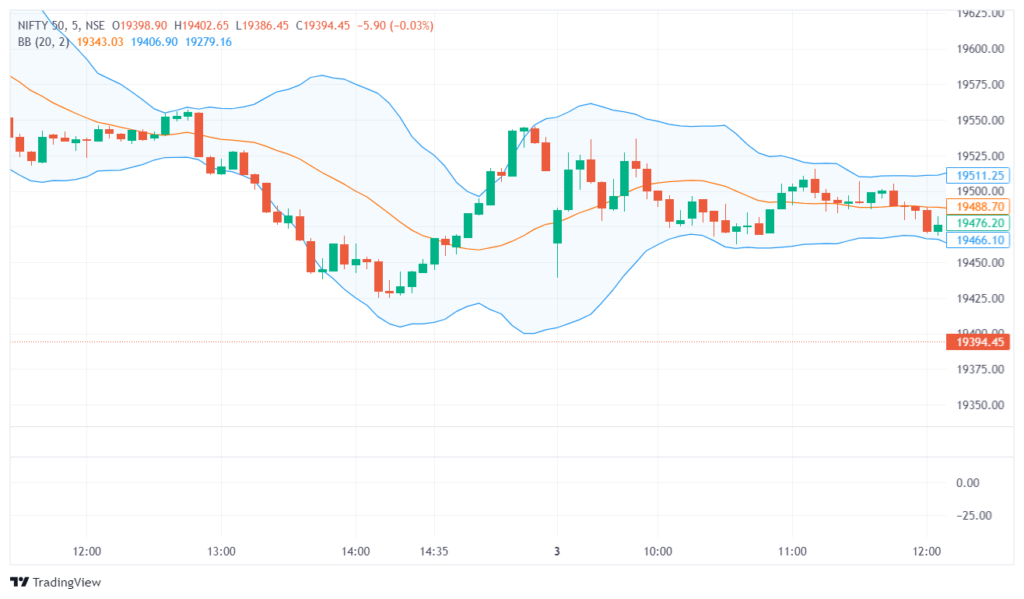

- The centre band represents the asset’s price over a given time, usually 20 periods, as a simple moving average (SMA). As the baseline, the middle band serves as an illustration of the price’s average for the selected time period.
- The top band is calculated by multiplying the middle band by a predetermined number of standard deviations (typically 2). The top band represents the “overbought” level, implying that the price is relatively high and may see a pullback or reversal.
- The bottom band is calculated by subtracting the same number of standard deviations (typically 2) from the middle band. The bottom band shows the “oversold” level, signalling that the price is relatively low and might potentially rebound.
Bollinger Bands are calculated using the following formula:
SMA (Simple Moving Average) = Middle Band
Upper Band = (Standard Deviation * K) + Middle Band
Lower Band = (Standard Deviation * K) Middle Band
Stochastic Oscillator
- Another well-liked technical analysis tool that traders use to identify the momentum of an asset’s price changes is the Stochastic Oscillator.
- The popularity of stochastics as a technical indicator can be related to its simplicity and high level of accuracy.
- It belongs to the category of technical indicators called oscillators.
- The two lines on a stochastic oscillator chart typically represent the oscillator’s three-day simple moving average and its actual value for each session.
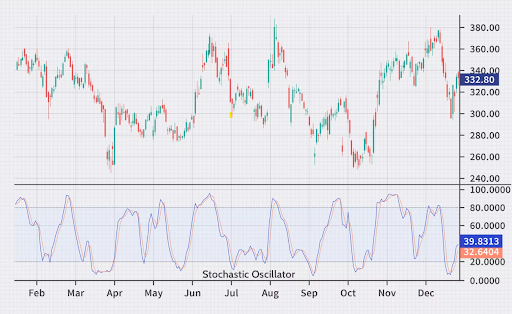

- The intersection of these two lines is regarded as a hint that a reversal may be imminent since price is believed to follow momentum and shows a significant movement in momentum from day to day.
- Another key reversal indication is the difference between the stochastic oscillator and trending price movement.
- An indication that bears are running out of steam and a bullish reversal is about to occur, for instance, is when a bearish trend makes a new lower low but the oscillator prints a higher low.
- To decide where to enter and leave the market, traders and analysts utilise the stochastic oscillator in combination with other technical indicators and chart patterns.
Average True Range
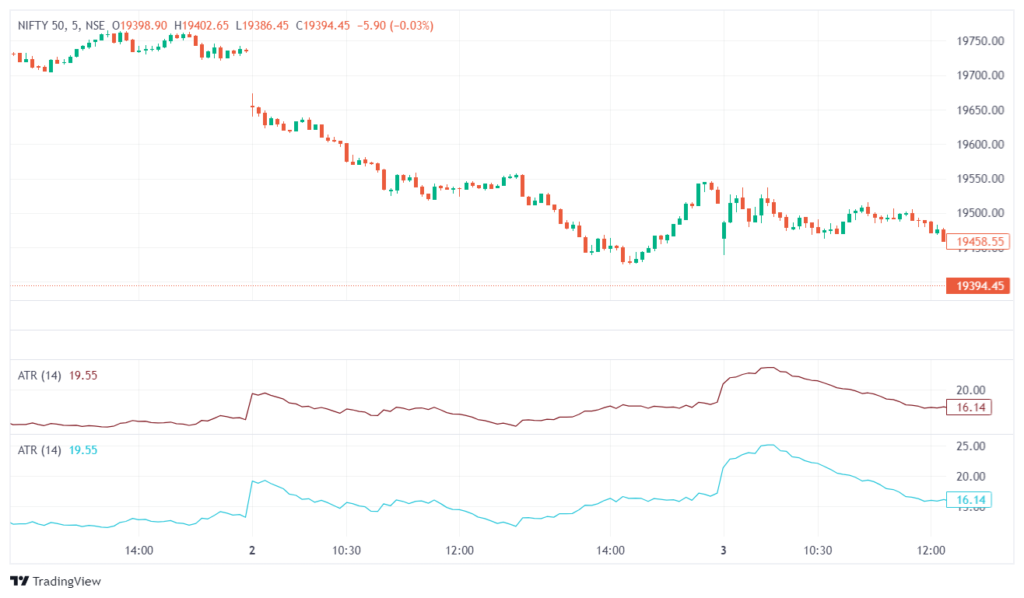
- Technical analysis tools like the Average True Range (ATR) are used to measure market volatility.
- The ATR gives investors and traders information about the degree of price volatility for a financial asset over a given time frame.
- Volatility may be determined by looking at the ATR: A larger ATR represents higher price volatility, whilst a lower ATR shows lesser volatility.
- Setting stop-loss and take-profit levels: Using the asset’s most recent price movements as a guide, ATR may assist traders in choosing suitable stop-loss and take-profit levels.
- Analyse the market’s volatility: A rising ATR may signify increased volatility, whilst a lowering ATR may signify a falling volatility.
- ATR may be used by traders to assess the volatility of various financial instruments and help them decide which assets best suit their risk appetite and trading tactics.

Conclusion
- In conclusion, swing trading is a well-known trading technique that entails maintaining positions for a number of days to weeks in order to profit from short- to medium-term price changes.
- Swing traders frequently employ a variety of technical indicators to help with trading choices.
- While these indications might offer insightful information, it’s important to keep in mind that no one indicator will ensure effective trading.
- Swing trading success necessitates a complete strategy that takes into account prudent risk management, thorough trade preparation, and other market variables including fundamental analysis and general market mood.
