IX Swap token price surged for four consecutive days, reaching its highest level since March 4.
IX Swap (IXS) climbed to a high of $0.2692, marking a 155% increase from its April low.
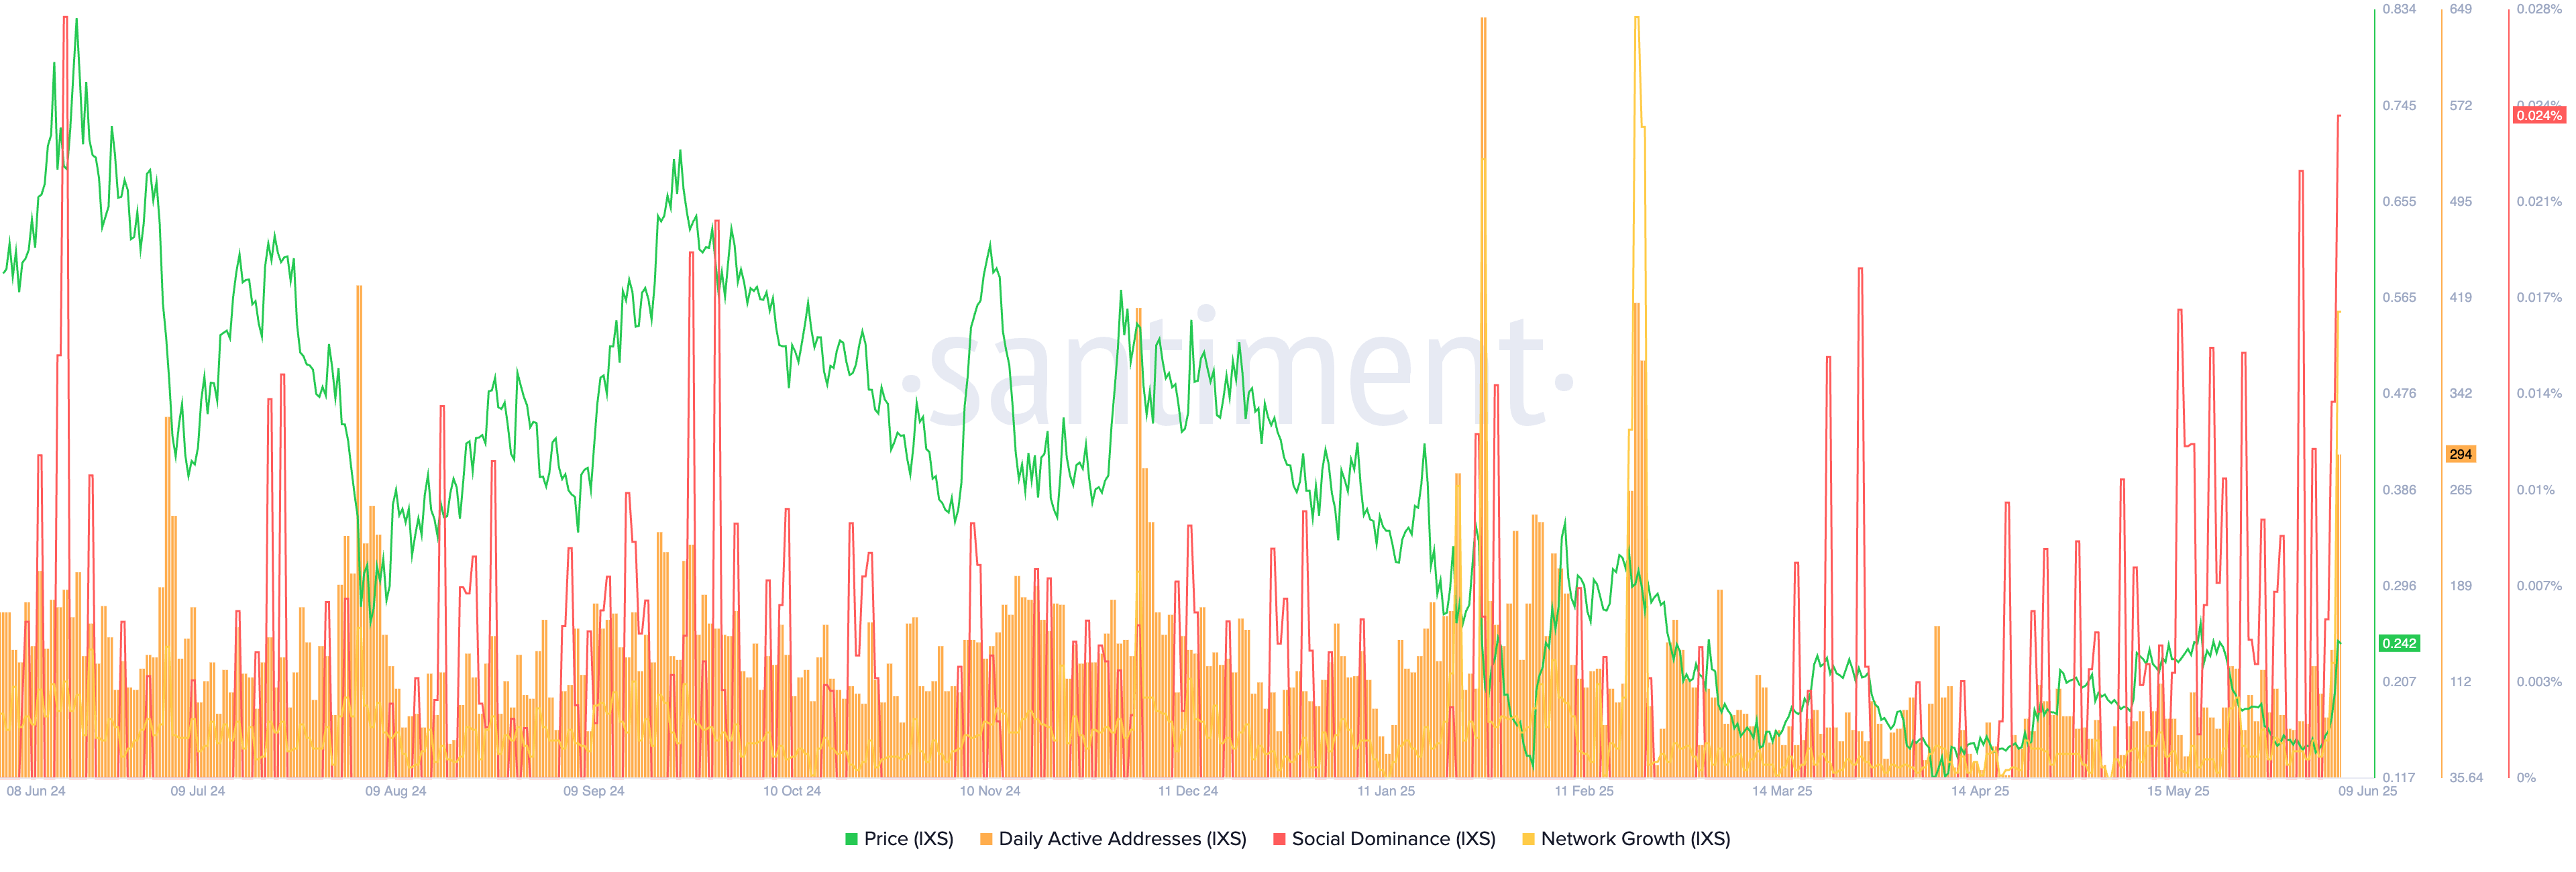
The rally coincided with a sharp rise in on-chain activity, as the number of active addresses jumped to 300, the highest since February. This spike in engagement likely reflects increased retail participation driven by fear of missing out.
A good example of this is that its social dominance soared to 0.024%, the highest point since June last year. Also, the network growth soared to 176, up from last week’s low of 12.

There was no specific news catalyst behind the IXS surge. As such, the move may be part of a pump-and-dump pattern, which is common among low-cap, thinly traded tokens.
IXS currently has a market capitalization of $42 million, with most of its trading volume concentrated on Uniswap (UNI). The token is not listed on major tier-1 exchanges such as Binance, Coinbase, or Upbit.
Another potential factor behind the move could be anticipation of a major announcement, such as a new partnership or exchange listing. It’s common for crypto tokens to rally in advance of such news.
Fundamentally, the IXS ecosystem remains relatively weak, with total value locked (TVL) in the network at just $449,844.
IXS’s platform allows Bitcoin (BTC) holders to monetize idle assets by earning yields between 4% and 10% without selling. Users pledge BTC as collateral, receive USDT, and deploy it into regulated, fixed-income real-world assets.
IXS crypto price technical analysis

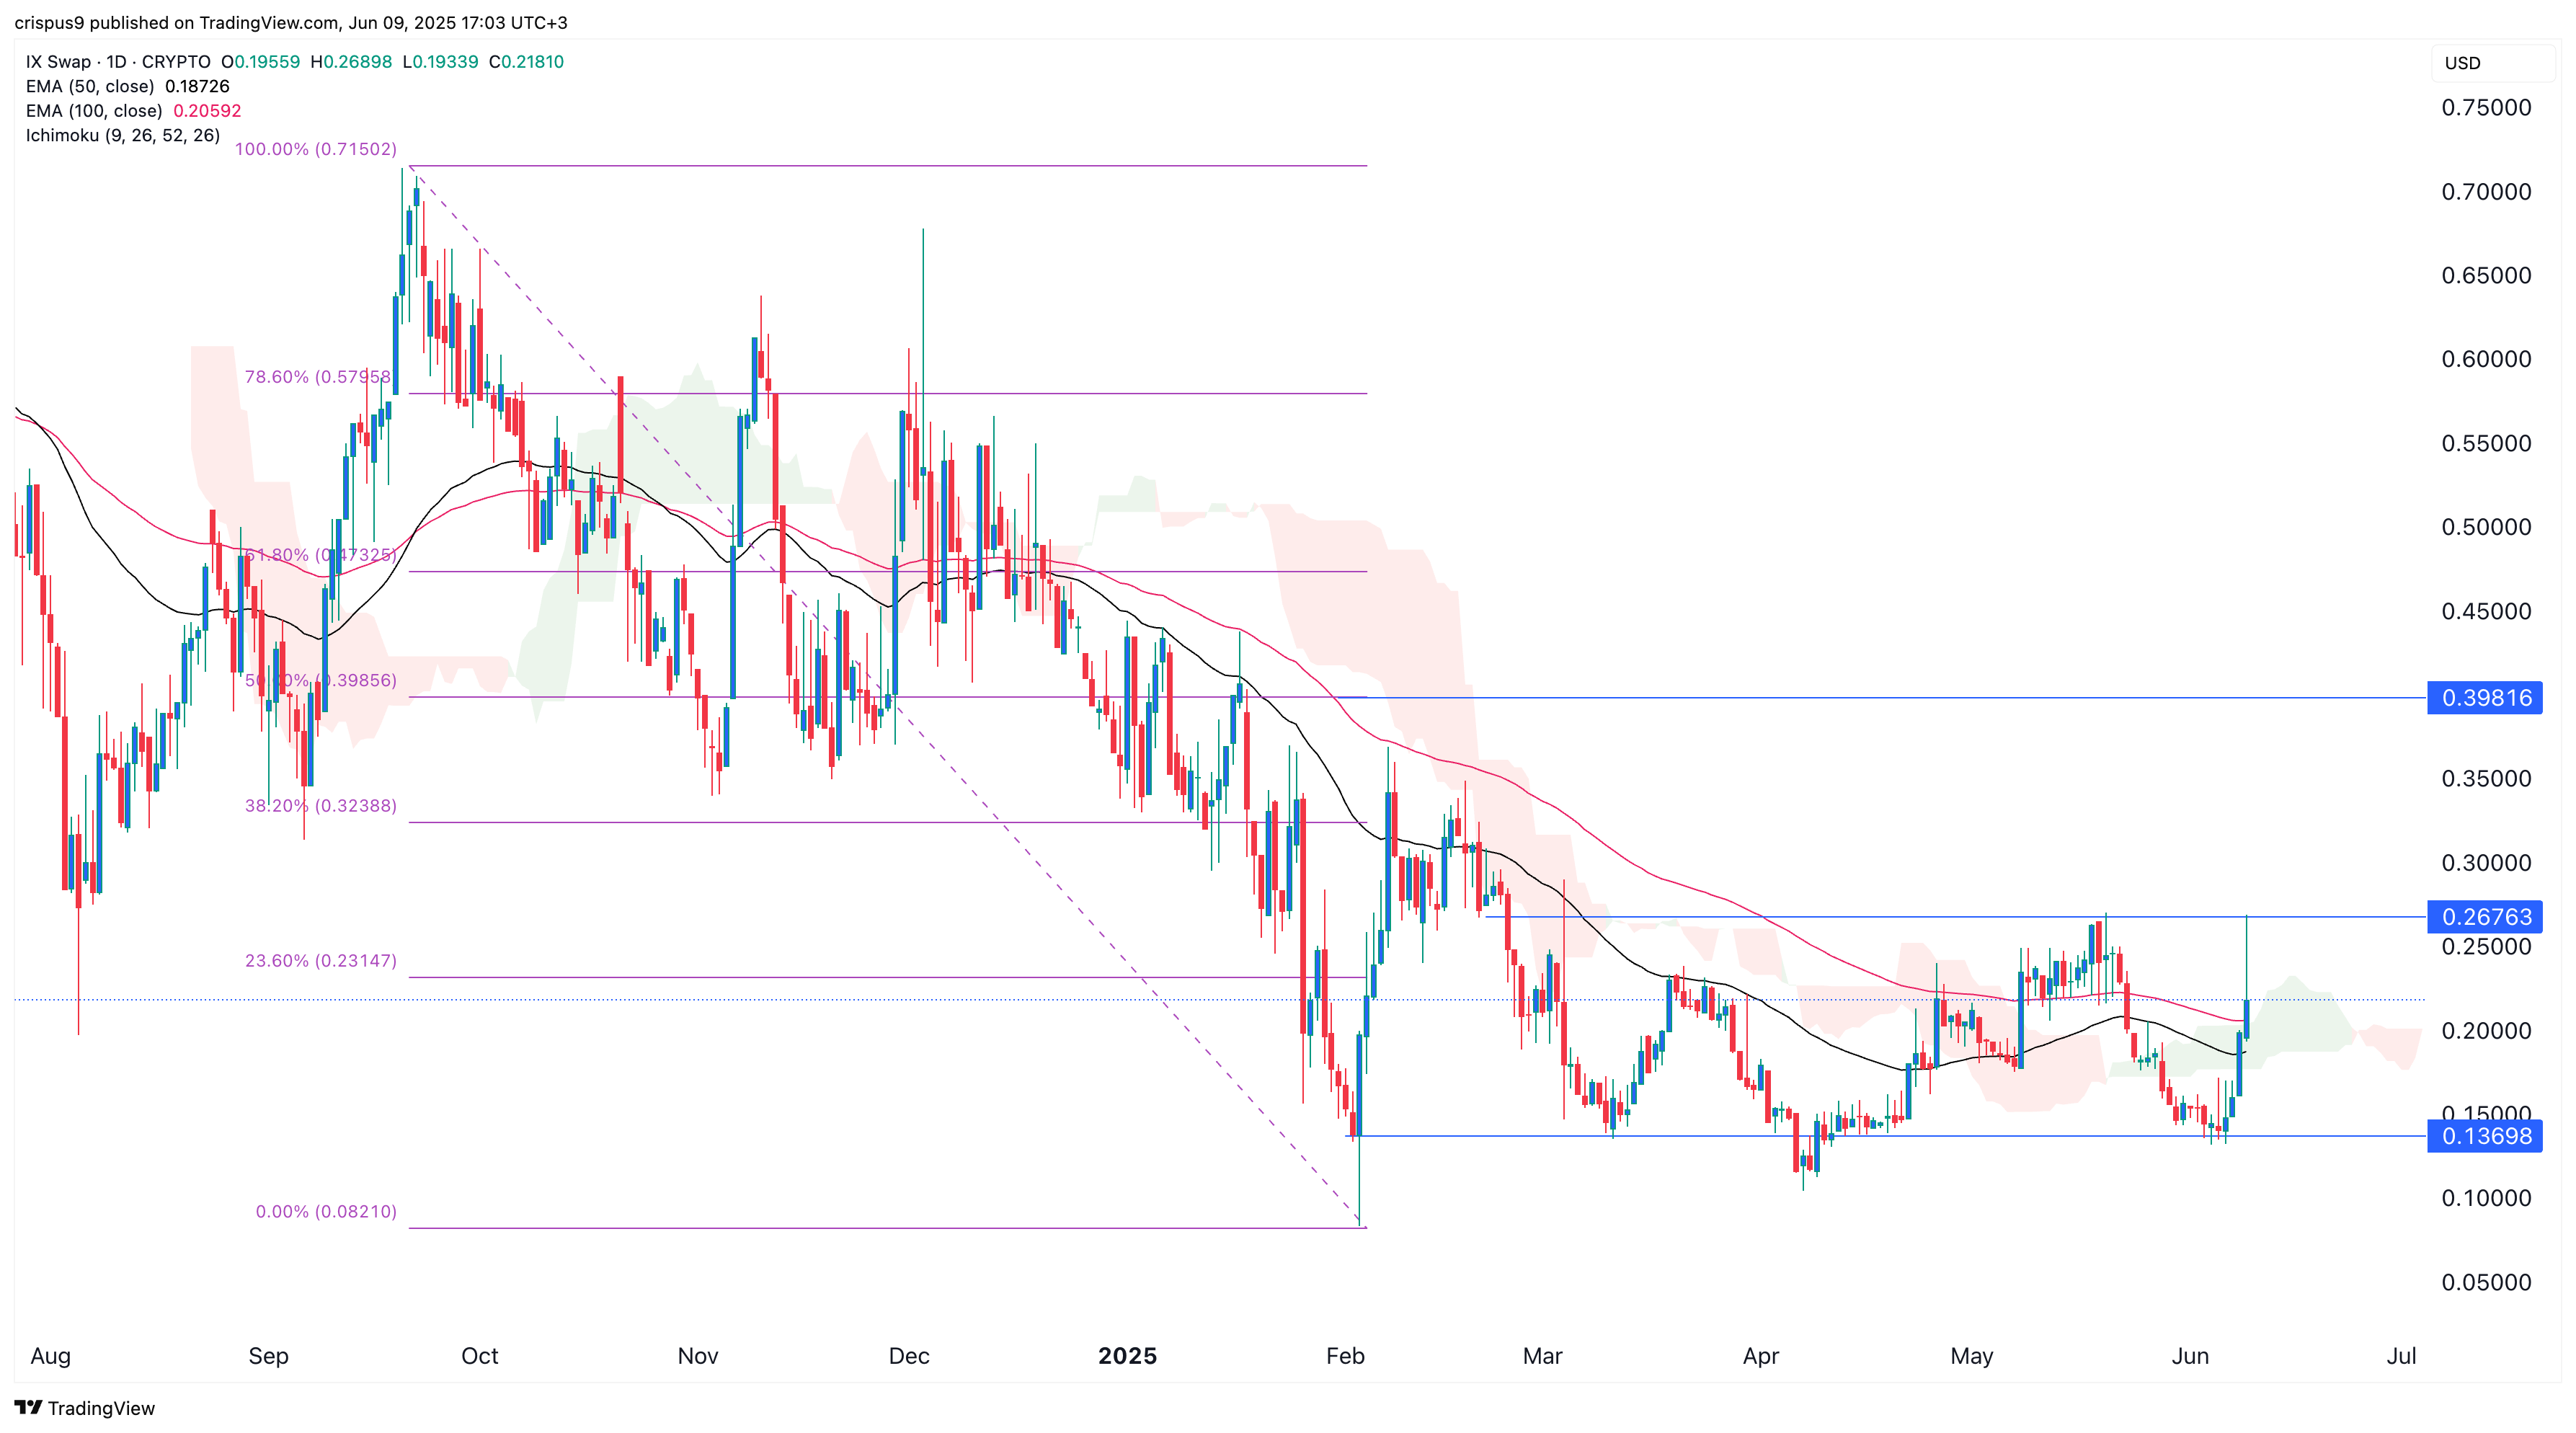
The daily chart shows that IXS bottomed at $0.1370 last week before rallying to $0.2676 on Monday, its highest point since March. The token briefly traded above the 50-day and 100-day Exponential Moving Averages, as well as the Ichimoku cloud indicator.
Given this sharp move, a near-term pullback appears likely as traders begin to take profits. If this occurs, price could fall toward the lower boundary of the channel near $0.1398. Conversely, a breakout above the channel’s upper bound at $0.2676 would open the door for further gains, with the next resistance sitting at the 50% Fibonacci retracement level of $0.3980.


