March 7, 2026 · Coincodecap · 2 min read ·
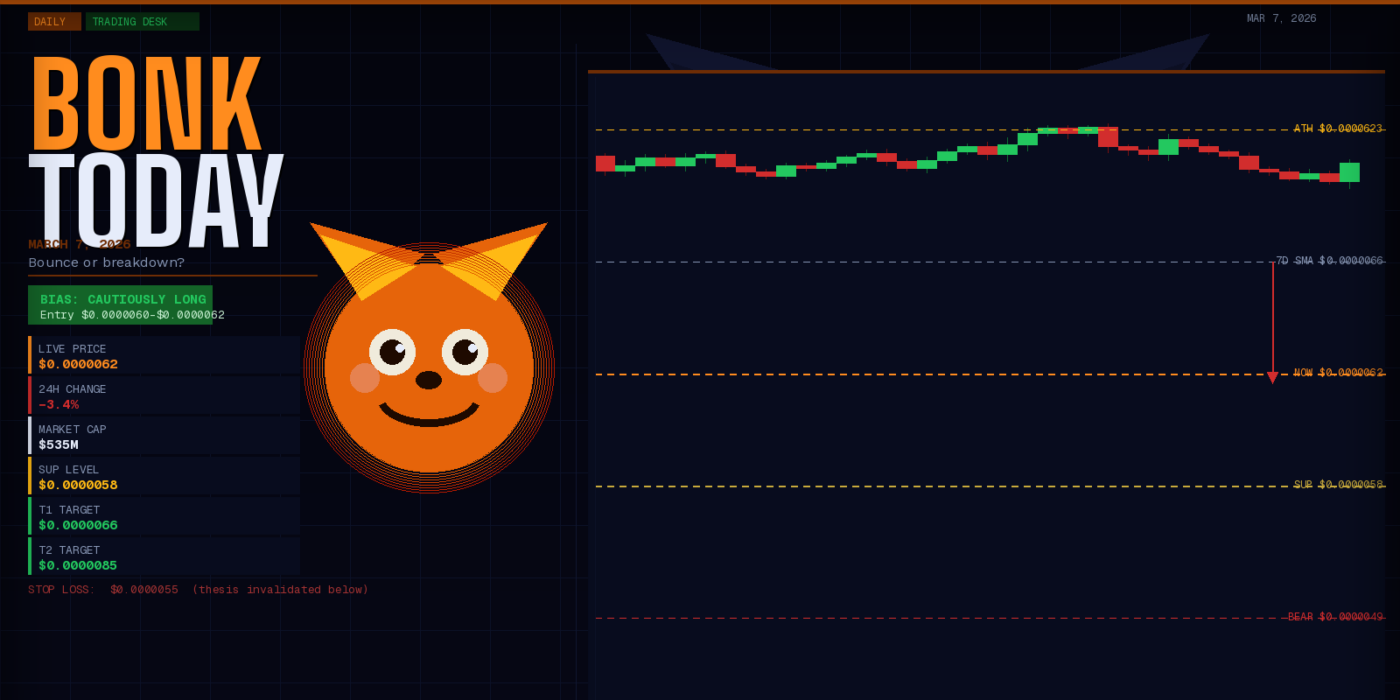
BONK is trading at $0.0000060–$0.0000065 today. It’s down 90% from its November 2024 ATH of $0.0000623. RSI is sitting in oversold territory and the $0.0000058 support held on three retests. The 24–48H setup is cautiously bullish if Bitcoin holds above $67K — but this is a high-beta memecoin trade. Size accordingly.
For on-demand analysis of any cryptocurrency, join our Telegram channel.
BONK Snapshot — March 7, 2026
| Metric | Live Data — Mar 7, 2026 |
| Price (Live) | $0.0000060 – $0.0000065 |
| 24H Range | $0.0000059 – $0.0000065 |
| 24H Volume | $55M – $65M USD |
| Market Cap | $532M – $538M (Rank #96) |
| ATH (Nov 2024) | $0.0000623 |
| Current vs ATH | Down ~90% |
| Key Support | $0.0000058 (3x tested) |
| Key Resistance | $0.0000066 → $0.0000085 |

Price is in a Downtrend, trading in Channel Down pattern. It needs to break out of the Channel to signal bullish trend reversal.

TRADE SETUP [LONG] Entry: $0.0000060–$0.0000062 (current price, on support) | Targets: T1: $0.0000066 (+10%), T2: $0.0000085 (+38%) | Stop: $0.0000055 (below 3x support — thesis broken) Counter-trend bounce play. BONK is oversold, BTC is holding $67K, and the $0.0000058 support has 3 clean tests. Entry at current price, first target is the 7-day SMA. Exit half position at T1. Let the rest run to T2 only if BTC reclaims $68,500.
What’s Happening Right Now
BONK has been grinding lower since its November 2024 ATH. It’s now down 90% — sitting in a range that historically precedes either final capitulation or a sharp oversold bounce. Volume spiked 50% on the last down leg, which means real selling happened. That’s actually constructive: panic selling that ends on a tested support zone is how bottoms form.
The $0.0000058 level has been the line three times. It held each time. That’s not an accident — it’s where buyers are. The question today is whether Bitcoin’s tentative stabilization above $67K gives BONK the fuel for a relief move.
Technical Setup — 1H & 4H
- RSI on the 1H chart: ~38–42. Not yet at classic oversold (30), but diverging positively — higher RSI lows while price makes equal lows. Classic bullish divergence setup.
- 4H chart: BONK broke its short-term descending trendline on March 6 with a small volume uptick. Not confirmed yet, but the structure is there.
- 7-day SMA sitting at $0.0000066. A daily close above that is the trigger for the next leg — TradingView analysts are flagging this as the key breakout gate.
- Head & Shoulders macro structure: The neckline breakdown is confirmed on the weekly. This means the broader trend is still bearish. Any bounce is a counter-trend trade — play it with a tight stop.
Catalysts to Watch (Next 48H)
- Bitcoin price action. BONK correlates 0.82 with the top 100 by market cap. BTC above $68,500 = green light. BTC below $66,000 = cut the trade early.
- LetsBonk.fun volume. BONK’s memecoin launchpad is one of Solana’s leading platforms. A spike in new token launches = demand for BONK fees = price catalyst.
- March 8 RSI watch. TradingView analysis flagged March 8 as a potential inflection point where RSI higher lows confirm. Watch the 1H close.
- Social sentiment. BONK is a pure community/meme token — LunarCrush social mentions are the leading indicator. A viral moment can move it 20–30% in hours.
Risk — Don’t Skip This
BONK is a memecoin. The macro H&S structure on the weekly chart still points toward $0.0000049–$0.0000028 as the full pattern target if support breaks. This is a counter-trend bounce trade, not a conviction buy. Use 1–2% of portfolio maximum. If $0.0000055 breaks on a daily close, the thesis is void — exit.
Bottom Line
Support is holding. RSI is diverging. BTC is stable. That’s three reasons to watch BONK today. It’s not a three-reason buy — it’s a one-reason-away-from-a-bounce setup. The reason is a BTC reclaim of $68,500. Until then: watchlist, not position.
For on-demand analysis of any cryptocurrency, join our Telegram channel.


