
Hyperliquid traded near $67 on June 15, according to crypto.news price data, after gaining more than 9% in 24 hours.
Summary
- HYPE traded near $67 after gaining more than 9% in 24 hours, crypto.news data showed.
- Ali Martinez said $65 remains key resistance; losing $54 would confirm HYPE’s bearish structure.
- ETF inflows and open interest rose, but RSI and MACD still show mixed momentum.
The token also rose more than 9% over seven days and more than 63% over the past month, keeping HYPE among the strongest large-cap crypto movers.
The latest move placed HYPE close to its June 2 all-time high of $75.48. Market data showed 24-hour volume near $871 million, while market capitalization stood near $14.9 billion. Hyperliquid held the No. 10 market rank, with a fully diluted value near $64 billion.
That rebound followed a sharp pullback from the early June peak. The token had dropped toward the mid-$50 area before buyers pushed it back into the $60 to $67 zone. This makes the current range important because it sits between recent support and the right-shoulder area flagged by analysts.
HYPE $65 resistance remains the key level
Crypto analyst Ali Martinez said HYPE is forming what looks like the right shoulder of a head-and-shoulders pattern.
“For now, $65 is the key resistance level,” he wrote. “Lose $54, and the bearish pattern would be confirmed.”
The four-hour chart places the left shoulder near the mid-$60 range, the head around $75.63, and the right shoulder below the same resistance area. This shows that buyers have not yet reclaimed the previous high after the drop from the head.
Price has recently traded near and above the $65 area, but traders still need to see whether it can hold that zone. A clean move above $65 would weaken the bearish setup and shift attention back toward the upper range.
The main support level remains near $54.61. If sellers push HYPE below that level, the chart would confirm the bearish pattern. The next downside levels marked on the setup sit near $48.14 and $40.66.
ETF inflows and derivatives activity rise
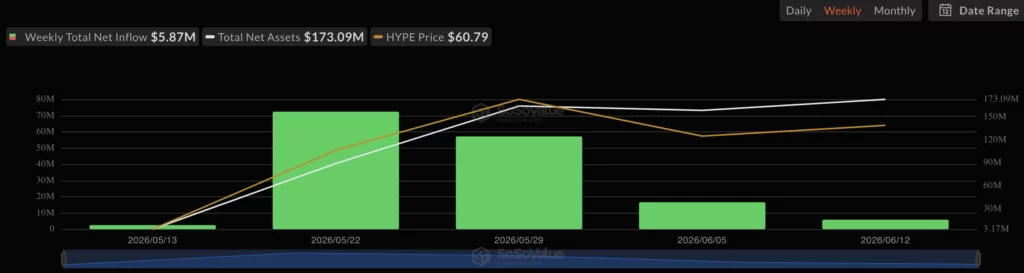
HYPE also drew new market activity through fund flows and derivatives. SoSoValue data showed HYPE spot ETFs recorded about $5.87 million in net inflows during the week from June 8 to June 12. Bitwise BHYP led the flows, while Grayscale HYPG also added inflows.
Coinglass data showed HYPE derivatives volume rising 69.69% to $3.61 billion. Open interest rose 11.36% to $2.86 billion. Rising open interest can point to stronger trader participation, but it can also raise liquidation risk when price moves fast.
Recent crypto.news coverage showed that derivatives interest had already been rising before the latest move. Kalshi launched CFTC-regulated HYPE perpetual futures for U.S. traders, while HYPE futures open interest climbed 10.7% to $2.48 billion at the time and moved above XRP.
Separately, Coinbase activated Hyperliquid’s USDC treasury after becoming the official USDC deployer for the network. That update came as Hyperliquid ecosystem activity expanded, with USDC serving as collateral for HIP-3 and HIP-4 markets.
These updates kept HYPE in focus as traders watched whether new products could support deeper liquidity.
Spot flow data also turned positive in the latest visible reading. Around June 15 at 03:00, HYPE showed about $2.32 million in netflow while trading near $67.31. Recent green bars showed stronger activity after several red outflow periods.
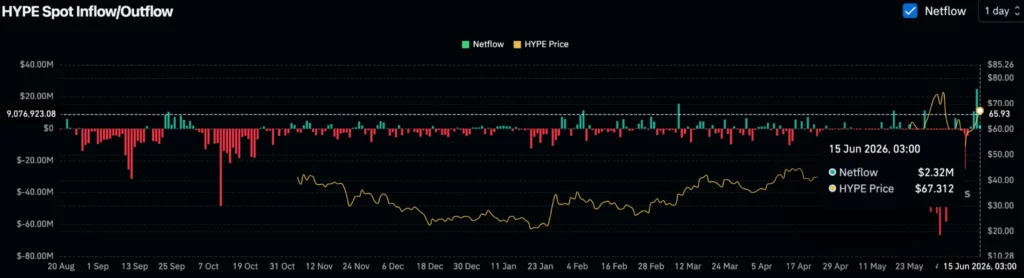
The flow picture remains mixed. Positive netflow can support price when it reflects buying demand. It can also show more tokens moving into spot platforms. For that reason, traders may watch whether price holds above $65 after the new activity.
Momentum signals stay mixed
Technical indicators show recovery, but not a clear bullish reset. The RSI stood at 58.74, while its moving average was around 54.89. This keeps RSI above the neutral 50 level and shows buyers still have momentum.
Even so, RSI has cooled from the recent overbought zone. That means momentum remains positive, but it has slowed from the strong rally that pushed HYPE near record highs. A fresh move above the recent high zone would make the bullish case stronger.
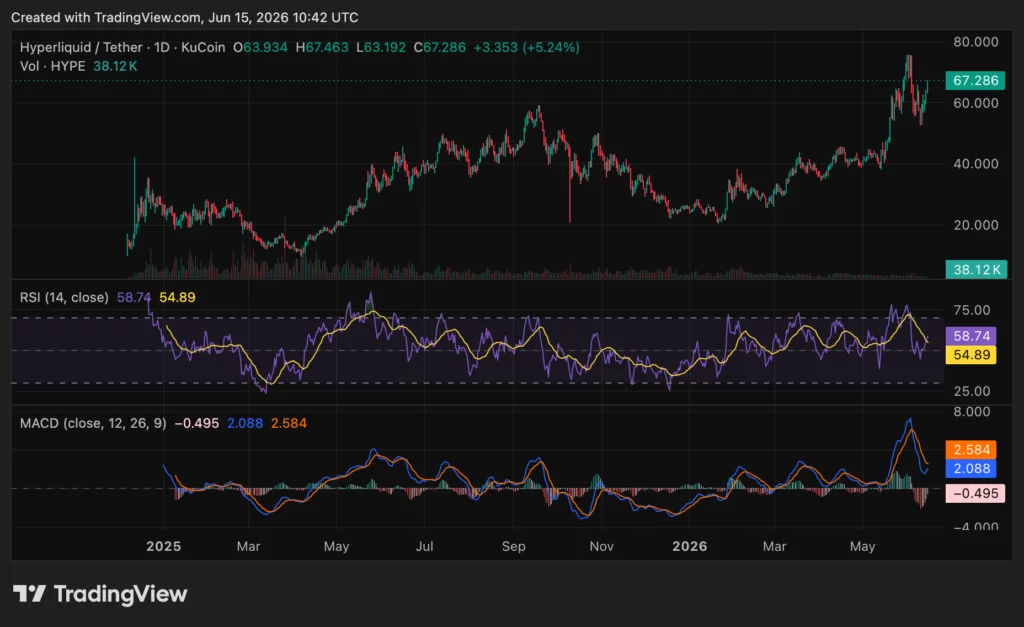
The MACD shows short-term weakness. The MACD line was near 2.088, below the signal line at 2.584, while the histogram was slightly negative at about -0.495. This points to softer momentum after the recent surge, even though price remains elevated.
For now, HYPE price analysis centers on two levels. A move above $65 that holds could weaken the head-and-shoulders risk and bring the all-time high back into view. A break below $54 would confirm the bearish structure and raise the risk of deeper consolidation.
Disclosure: This article does not represent investment advice. The content and materials featured on this page are for educational purposes only.


