
Solana price is approaching a bullish breakout from a falling channel as its first U.S. spot ETF goes live.
Summary
- Solana price is up 14% from its 7-day low.
- Investor demand spiked after Bitwise’s BSOL started trading on NYSE Arca.
- SOL price action has shaped a bullish reversal pattern over the past two months.
According to data from crypto.news, Solana (SOL) price rose 14% from its Oct. 23 low to an intraday high of $204.48 on late Monday before settling at $202.25 as of press time. Despite this, the token remains roughly 20% lower than its September high of $252.78.
Over the past 24 hours, daily trading volume for the token rose by 5.4% to over $6.38 billion, indicating growing investor demand for Solana and pushing its market cap above $111 billion.
Solana’s price gains were largely fueled by growing community hype surrounding the launch of its first spot ETF in the U.S.
Launched on Oct. 28 by asset manager Bitwise and listed on NYSE Arca under the ticker BSOL, the fund is the first U.S. spot Solana ETP offering 100% direct exposure to SOL, while also including staking functionality, a feature that sets it apart from traditional spot ETFs.
The launch could pave the way for greater institutional accessibility to Solana, potentially increasing exposure and investor interest in the token over the long run.
Hype around the launch was visible in terms of exchange outflows, as data from Coinglass shows that nearly $1 billion worth of SOL tokens were withdrawn from exchanges in the past 48 hours.
Meanwhile, Solana’s price has also found support from growing institutional interest, with several firms beginning to include SOL in their digital asset treasuries. On Oct. 27, Reliance Global Group, a Nasdaq-listed company, announced it had added Solana to its digital asset treasury, joining the likes of Bitcoin (BTC) and Ethereum (ETH).
Such accumulation by a publicly traded firm strengthens the case for Solana’s evolution into an institutional-grade asset. If more corporates and funds follow suit, this could provide a firmer foundation for a sustained uptrend in the months ahead.
On the daily chart, Solana price is eyeing a bullish breakout from a falling channel that has developed over the past two months. The pattern, characterized by lower highs and lower lows within two parallel downward-sloping trendlines and signals a potential trend reversal in favor of bulls.
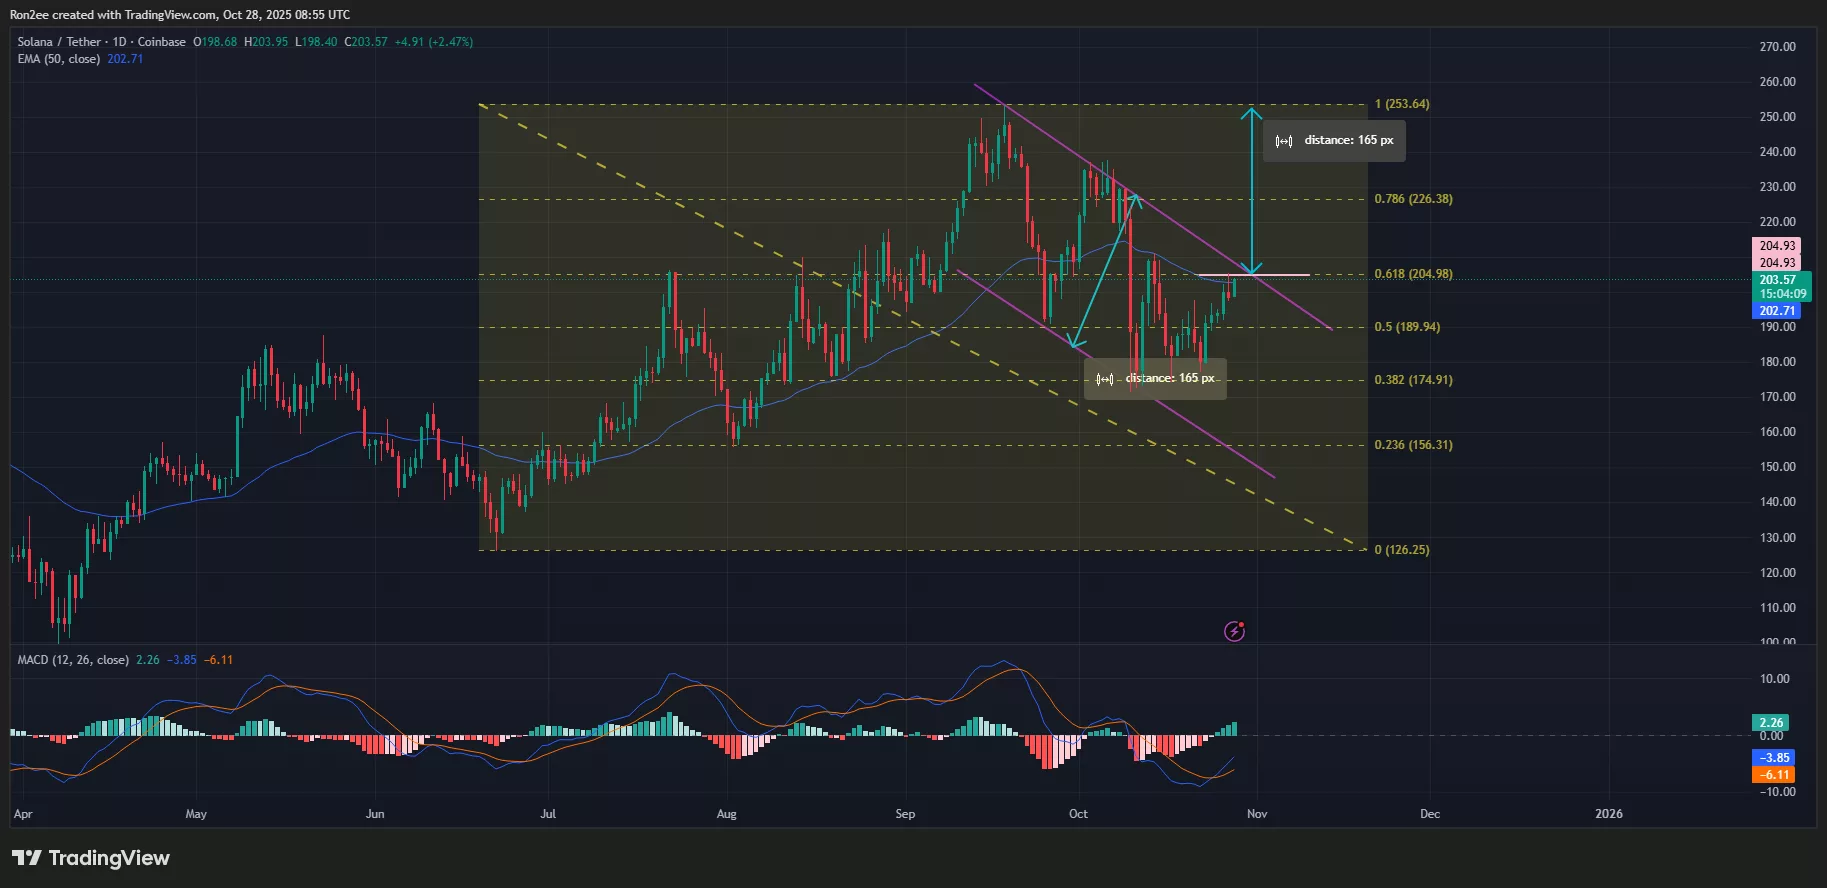
As of now, the key resistance level lies at the 61.8% Fibonacci retracement at $204.98, a crucial zone that also aligns with the neckline of the double-bottom pattern forming within the structure.
A decisive breakout above this area could open a rally toward $226.38, the 78.6% retracement level, and potentially all the way up to $252.78, the September high, up nearly 23% from the current price.
Momentum indicators seem to be in favor of the bulls. Notably, the MACD has recently formed a bullish crossover with the signal line, signaling that upward momentum is starting to build.
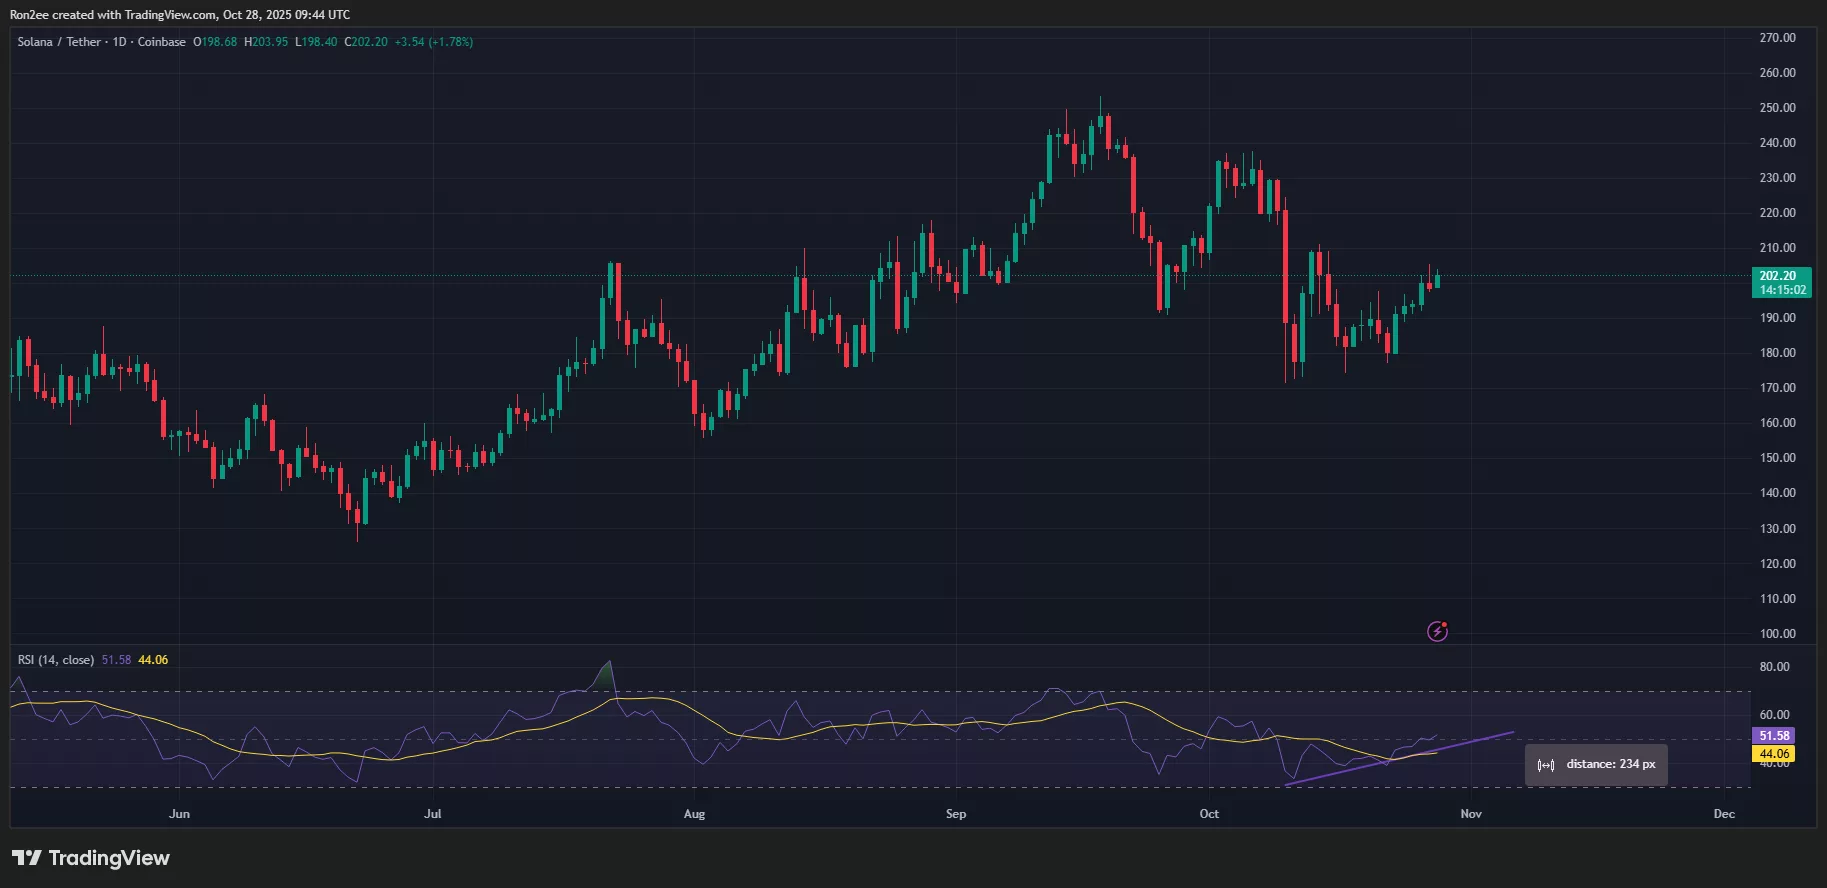
Meanwhile, the RSI has printed a bullish divergence, suggesting that despite recent price lows, buying pressure has quietly been increasing, a common early sign of a breakout attempt.
If bulls can’t hold the momentum, support is expected around $189.94, the 50% Fibonacci level. A drop below that could likely lead Solana down to $174.91, where buyers might step in again.
Disclosure: This article does not represent investment advice. The content and materials featured on this page are for educational purposes only.


