The weekend of February 28, 2026 did what weeks of quiet deterioration couldn’t: it cracked market confidence in one clean move. US and Israeli forces launched coordinated strikes on Iran’s missile systems, naval bases, and nuclear facilities. Within hours, Bitcoin — already down nearly 47% from its October 2025 peak of $126,080 — dropped to an intraday low of $63,030. Over $522 million in leveraged positions were liquidated in a single 24-hour window. Gold hit $5,400, gaining roughly a trillion dollars in market value in six hours. Crypto went the other way.
This piece breaks down exactly what happened, the data behind it, and — based on historical pattern analysis — where things go from here. No padding, no vague sentiment commentary. Just the numbers and the logic that connects them.
Where Bitcoin and Crypto Stood Before the Strikes
The narrative around the US-Iran conflict is tempting to treat as a sudden shock to a stable market. The data tells a different story. Bitcoin had been in a sustained bear cycle for months before the first bomb fell.
Here is the pre-conflict picture, condensed into what actually mattered

- BTC peaked at $126,080 on October 7, 2025, then entered a textbook distribution phase. By late February 2026, it had shed nearly 47% of that value, grinding down through $95,000, $84,000, and eventually testing $60,000 — a level it had not seen since October 2024.
- US spot Bitcoin ETFs had reversed course. In 2025, they were net buyers of approximately 46,000 BTC. By February 2026, they had flipped to net sellers, with five consecutive weeks of outflows — a meaningful institutional signal that reactive capital was pulling out.
- A massive liquidation event in late January 2026 had already shaken confidence. Bitcoin recovered to $72,270 in a relief rally, but bulls couldn’t follow through, leaving a clear lower high on the chart.
- On Deribit, the $60,000 put had become the most heavily held put option by open interest, with roughly 5,200 BTC in position. When the market’s largest bets are positioned for pain, they tend to attract the pain they’re priced for.
- Bitcoin’s technical structure on the daily chart had stalled in a $65,000–$72,000 range on thin volumes — classic consolidation before a breakdown, confirmed by Standard Chartered’s public warning of further downside in the week before the strikes.
The geopolitical shock didn’t build the bear trend. It handed it momentum it couldn’t manufacture on its own.
The Strikes and the Immediate Market Fallout
In the early hours of Saturday, February 28, US and Israeli forces struck Iranian nuclear facilities, missile infrastructure, and naval assets. Trump publicly described the operation as ‘major combat operations.’ Iran retaliated with drones and missiles targeting Israeli sites and US bases across the Gulf, causing airspace closures in Kuwait and Bahrain. Dubai and Abu Dhabi financial markets announced rare closures for March 2 and 3 — not framed as panic, but telling.
The crypto market’s immediate response unfolded across four measurable dimensions
Price: Bitcoin dropped from above $67,000 pre-weekend to an intraday low of $63,030. By Monday morning it had recovered to around $65,776–$66,778, — every attempt to push above $68,000 was being sold into.
Liquidations: $522 million in leveraged positions cleared in 24 hours, the majority long positions. The cascade dynamic — forced liquidations pushing price down, triggering further liquidations.
Volume: Abnormally elevated sell-side volume on red candles. The RSI printed at 35, approaching oversold. The ADX hit 52, confirming a strong directional trend — downward.
Gold vs BTC: Gold gained roughly $1 trillion in market cap in six hours on the Iran news, reclaiming $5,400. Bitcoin did not get a single cent of that safe-haven bid. The divergence was not subtle.
One data point worth flagging: despite the panic selling, approximately 522 BTC left exchanges in the same 24-hour period. Someone — likely large holders — was buying what retail was throwing overboard.
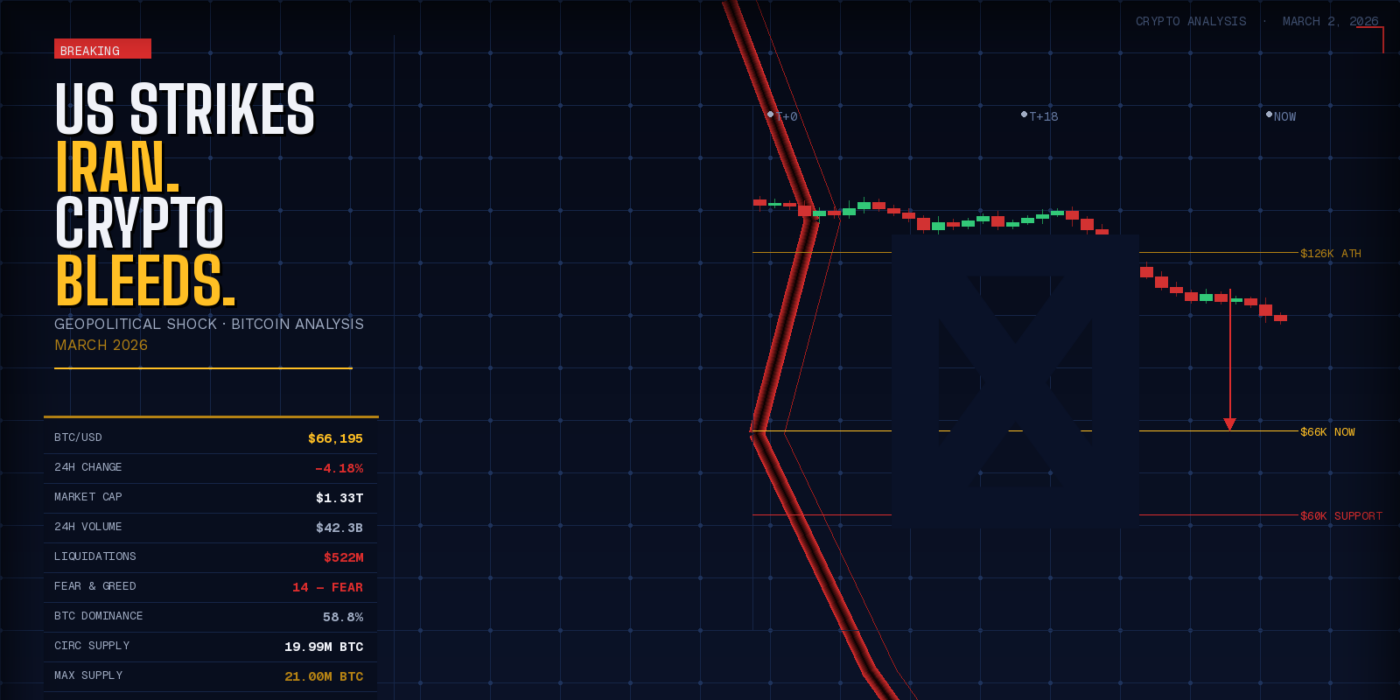
Bitcoin Live Data — March 2, 2026
Below is a complete metric breakdown of Bitcoin along with the chart and next direction
| Metric | Live Data |
| Live Price (Mar 2, 2026) | $66,195–$66,779 USD |
| 24h Intraday Low / High | $63,030 / $68,159 |
| Market Cap | $1.33 Trillion (Ranked #1) |
| 24h Trading Volume | $38.5B – $45.5B USD |
| Circulating Supply | 19,996,665 |
| Total / Max Supply | 21,000,000 BTC |
| All-Time High | $126,080 – $126,199 (October 7, 2025) |
| Current vs ATH | Down approx. 47% from cycle peak |
| 52-Week Range | $60,187 – $126,186 |
| BTC Dominance | 57.88%–60% of total crypto market cap |
| Fear & Greed Index | 14 — Extreme Fear |
| ETF Flow (Recent) | 5 weeks of net outflows, snapped by $1B+ inflow (Feb 26–28) |
| Rainbow Chart Zone | ‘Accumulate’ band (historically strong buy zone) |
| YTD Performance | Down 23.9% year-to-date |

Price is in a Downtrend. It got rejected at $70K resistance for the 3rd time. We would be buyers on pullbacks near $60K key level where it found support recently and could be an attractive trade entry. Overall, we expect a period of consolidation in the $60,000 – $70,000 range for weeks before resuming its Uptrend.
Historical Precedent: Three Times This Market Has Seen This Movie
June 2025 — US Strikes Iranian Nuclear Facilities
Bitcoin had a comfortable run above the level of $100,000 when the first US strikes on Iran landed in mid-2025. It crashed to just below $105,000 within hours — roughly $40B in market cap wiped. Over $1B in long positions were liquidated in the first 24 hours. The market felt catastrophic in real time. Then it rallied 62% over the next two months and hit new all-time highs. The panic bottom had been the entry point of the year for anyone with a stomach for it.
April 2025 — Iranian Retaliation Strikes on Israel
Same dynamic, smaller scale. BTC dropped on the initial shock, recovered once the situation appeared contained. Prices bounced further after Trump signaled a pause in operations — a pattern that shows how tightly crypto markets are keyed to political language, not just military action itself.
January 2020 — Soleimani Assassination
Bitcoin briefly spiked — a flicker of safe-haven behavior — then returned to trading as a risk asset. The spike didn’t hold. The lesson stuck: in the immediate term, crypto is a risk asset first. The safe-haven narrative is a long-game story, not a crisis-week story.
The through-line across all three events is the same: initial panic, forced liquidations, temporary bottom, then recovery once the situation stabilized. February 2026 is the same script in a different macro context — and the context is meaningfully worse than 2025, which is why the recovery timeline looks murkier this time.
Why Bombs and Bitcoin Move in Opposite Directions
The risk-off reflex. Institutional money classifies crypto as a risk asset. When uncertainty spikes, allocators de-risk — selling volatile positions to cover margin elsewhere or rotate into gold and Treasuries. Bitcoin doesn’t yet occupy that ‘flight to safety’ shelf for the majority of large capital.
The liquidation cascade. Crypto markets run on leverage in a way most traditional markets don’t. Once price crosses a margin threshold, positions are automatically liquidated — and those liquidations push price lower, triggering the next wave. The $522M liquidated last weekend wasn’t human panic; it was automated systems feeding on themselves.
The oil premium. Iran controls access to the Strait of Hormuz, through which roughly 20% of global oil supply moves. Iran has already claimed it closed the strait. Higher oil drives inflation fears, which tightens Fed policy expectations, which contracts global liquidity. Less liquidity means less risk appetite — poison for speculative assets.
Strait closure and Saudi refinery hit. Iran reportedly struck a Saudi Aramco oil refinery over the weekend, pushing oil prices up sharply. Gold gained $200 per ounce in a single session. Silver hit $96. The commodity safe-haven bid was decisive and directional — and crypto didn’t catch a cent of it.
Three Scenarios and the Price Levels That Define Them
Scenario A: De-escalation (Short Squeeze Risk)
Diplomatic talks were already scheduled in Oman for early March. Iran confirmed the death of Supreme Leader Khamenei in the strikes — a development that briefly sent BTC above $68,000 as markets priced in potential regime change and a shorter conflict. If a ceasefire or diplomatic signal emerges, the market’s extreme short positioning — roughly $8B in shorts versus under $200M in longs on major exchanges — creates conditions for a violent short-covering rally.
Key resistance: $67,800–$68,500. A sustained close above $70,000 changes the technical picture materially.
Scenario B: Prolonged Conflict, No Escalation
Bitcoin grinds sideways in the $62,000–$67,000 band with volatility spikes on each news event. Painful for traders, survivable for holders without leverage. Mercado Bitcoin’s head of research has flagged a potential bottom for BTC priced in gold as early as March 2026, based on 12–13 month bear cycle patterns. In USD terms, the downturn could extend into late 2026.
Scenario C: Full Regional Escalation
If the Strait of Hormuz closes for real, or if broader Gulf state involvement materializes, Bitcoin tests $60,000–$58,000. Standard Chartered has already flagged that a sustained breach of $60,000–$58,000 could trigger deeper losses toward the high $40,000s. That is the tail risk. Not the base case, but not a number worth ignoring.
What Smart Money Is Actually Doing Right Now
Coinbase reported a $667M loss in Q4 2025, with revenue down over 20% to $1.8B. Retail trading volumes have collapsed. But large capital is moving quietly in the other direction.
- Abu Dhabi sovereign investment firms Mubadala Investment Company and Al Warda Investments both added spot Bitcoin ETF exposure in mid-February 2026.
- US spot Bitcoin ETF inflows snapped a five-week outflow streak, recording over $1B in net inflows across three straight days around February 26–28 — the same weekend the strikes happened.
- A crypto whale swapped 1,000 ETH for 358.49 XAUT (tokenized gold) at $5,413 per token.
- Macroeconomist Henrik Zeberg, in his March 2026 portfolio outlook, wrote that Bitcoin could rally to $110,000–$120,000 in the primary scenario.
The accumulation signal from whales and sovereigns during this conflict mirrors exactly what happened in June 2025 — the last time geopolitics crashed the market and handed patient buyers one of the year’s best entry points.
Altcoins, Privacy Coins, and the Broader Market
- ETH fell 0.93% to $1,939 on Monday, March 2, despite record staking of 37.1 million ETH and declining exchange supply. The staking story isn’t moving price when risk sentiment is this bad.
- XRP dropped 2.93% to $1.352, tracking the broader decline. Solana bucked the trend, rising 0.98% to $83.60 on strong developer activity — the one asset that found a bid.
- Total crypto market cap fell 1.87% to $2.25 trillion. Bitcoin dominance sits at 57.88%–60%, reflecting the standard ‘flight to quality within crypto’ pattern during risk-off periods.
- Monero (XMR) is up over 56% year-over-year despite a January correction. Zcash (ZEC) is up over 500% in the past 12 months. Privacy coins are the anomaly: in conflict zones where banking infrastructure is under stress or sanctions are active, their transactional utility becomes visible in price action.
- Stablecoin inflows are surging. USDT and USDC combined volume now represents 97.3% of total 24-hour crypto market volume — effectively showing where traders are parking capital while they wait.
Final Word
The US-Iran conflict arrived in a market that had already lost nearly half its peak value, with institutional ETF flows in reverse and the Fear & Greed Index at 14. That is a different entry point than June 2025, when Bitcoin absorbed the same geopolitical shock from above $100,000 and then rallied 62% to all-time highs.
The pattern from every prior US-Iran escalation is consistent: panic drop, forced liquidations, accumulation by large capital at the lows, recovery once the political temperature falls. The questions this time are the same as always — how long does the conflict last, and how does the macro context respond. Oil at these levels and liquidity contracting is not a friendly backdrop. But the Bitcoin Rainbow Chart putting BTC in the ‘Accumulate’ zone, $8B in short positions that could unwind violently, and sovereign capital quietly adding exposure during the fear? That combination has paid off before.
The $63,000–$60,000 zone is the line that matters. Hold it and the recovery thesis survives. Lose it and Standard Chartered’s $48,000 scenario moves from tail risk to discussion.
Watch the Oman talks. Watch the oil price. Watch exchange outflows. And trade the market you have, not the one that existed in October 2025.
For on-demand analysis of any cryptocurrency, join our Telegram channel.


