

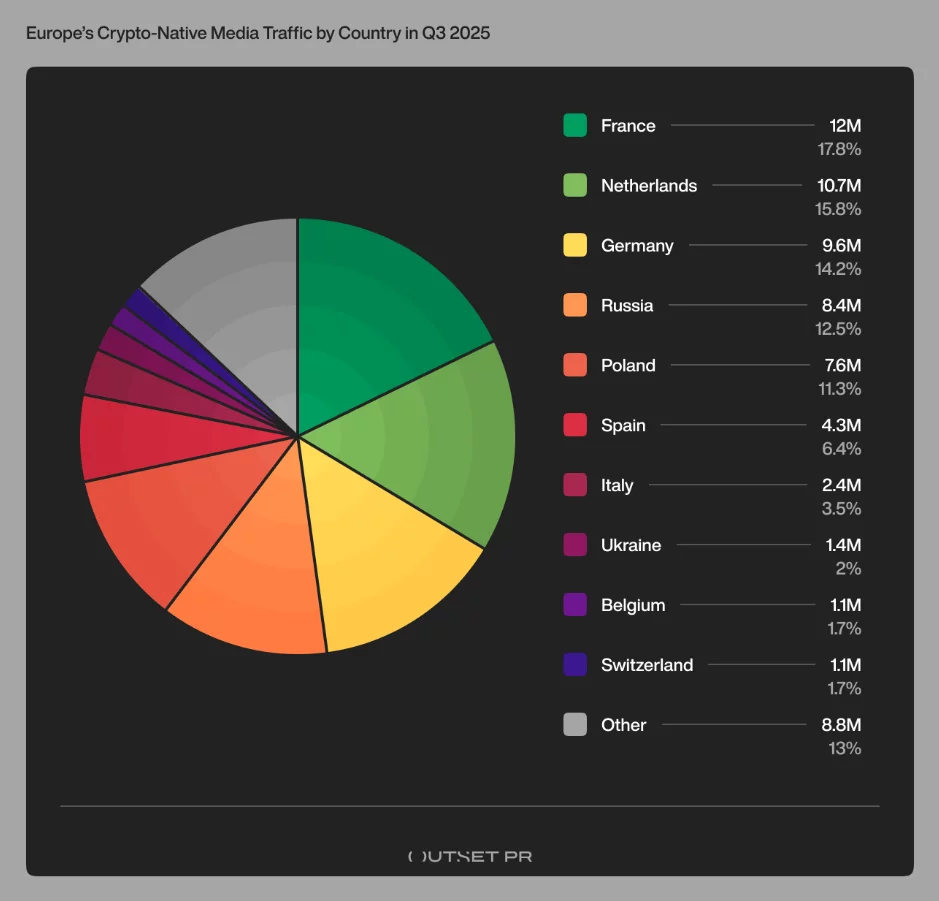
When we started digging into Europe’s crypto media traffic in the third quarter of 2025, one thing became obvious very quickly: just five countries accounted for 72% of all crypto-native media visits across Europe.
Out of roughly 67 million total visits recorded during the quarter, nearly three-quarters came from France, the Netherlands, Germany, Russia, and Poland.
Summary
- France, the Netherlands, Germany, Russia, and Poland account for 72% of Europe’s crypto-native media visits in Q3 2025.
- While total Q3 traffic rose about 4% from Q2, visits declined month by month after a strong July, with Eastern Europe providing most of the quarter’s net growth.
- A small group of large publishers captured nearly 60% of all traffic.
What’s also worth noting here is where those five countries actually sit. Three of them are Western European markets where most people still find crypto news through search and the same big sites. The other two are in Eastern Europe, where readers usually go straight back to the crypto sites they already know instead of finding new ones.
Put together, the numbers point in a pretty clear direction. Most of the attention is ending up in markets where search still works, or where readers already know which crypto sites they check, and those two things are increasingly what decide who gets seen.
The Countries Behind Europe’s Crypto Media Traffic
These three markets sit at the center of Western Europe’s crypto media traffic, largely because search still delivers scale and local publishers have been around long enough to benefit from it:
- France led Europe in Q3 with 12 million visits, accounting for almost 18% of total crypto-native traffic.
- The Netherlands followed with 10 million visits
- Germany recorded slightly above 9.5 million.
On the Eastern side: Russia got almost 8.5 million visits, and Poland followed closely with 7.6 million. Even with tighter rules in place, crypto readers in these markets still tend to come back directly and visit the same outlets over and over.
Spain comes next with around 4 million visits, which puts it clearly below the top group but still ahead of most Western European markets. Italy followed with roughly 2.4 million visits, Ukraine came in at about 1.4 million visits, while Belgium and Switzerland each landed a bit over 1 million, much of that traffic coming through pan-European publishers instead of local-only platforms.
After that, the numbers start to thin out. Hungary, Ireland, Austria, Belarus, Slovakia, and the Czech Republic all show up with steady but smaller volumes, each adding a modest share to Europe’s overall traffic.
Further down the list, Bulgaria, the UK, Romania, Latvia, Greece, and Croatia continue to register crypto media activity at a lighter level, rounding out the long tail of European readership.

Growth at the quarter level, declines month by month
At a glance, Europe’s crypto-native media traffic was slightly higher in Q3. Total visits were up from Q2 by about 4%, continuing off a stronger starting point. If you stop there, it appears that things leveled out after the earlier drop in the year. Yet, the monthly numbers do not support that interpretation.
Traffic was highest in July, at just under 24 million visits, and then declined through the quarter, ending September with just over 20 million.
By the time Q3 concluded, that amounted to a drop of approximately 13%. The quarter finished higher primarily because it started strong, not because traffic increased as the months went on.

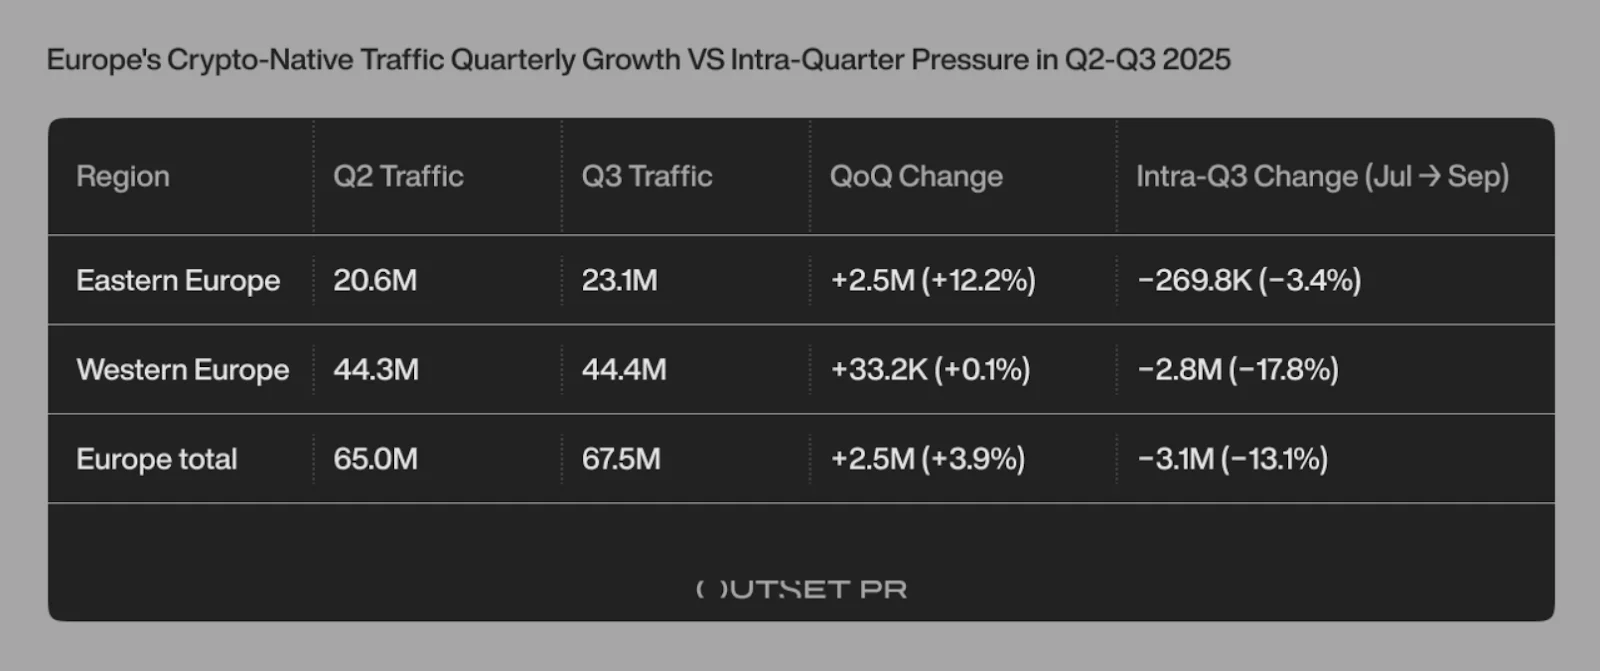
Seen through that lens, Q3 wasn’t so much a turnaround as a period where existing patterns held. The same five countries that dominate Europe’s crypto media traffic were also the ones that kept overall numbers from slipping further.
Eastern Europe accounted for most of the net growth in Q3, up by more than 12% from Q2, and traffic there remained relatively steady from month to month.
Western Europe still accounted for a substantial share of the activity overall, even as numbers eased through the quarter.
The same countries keep rising to the top
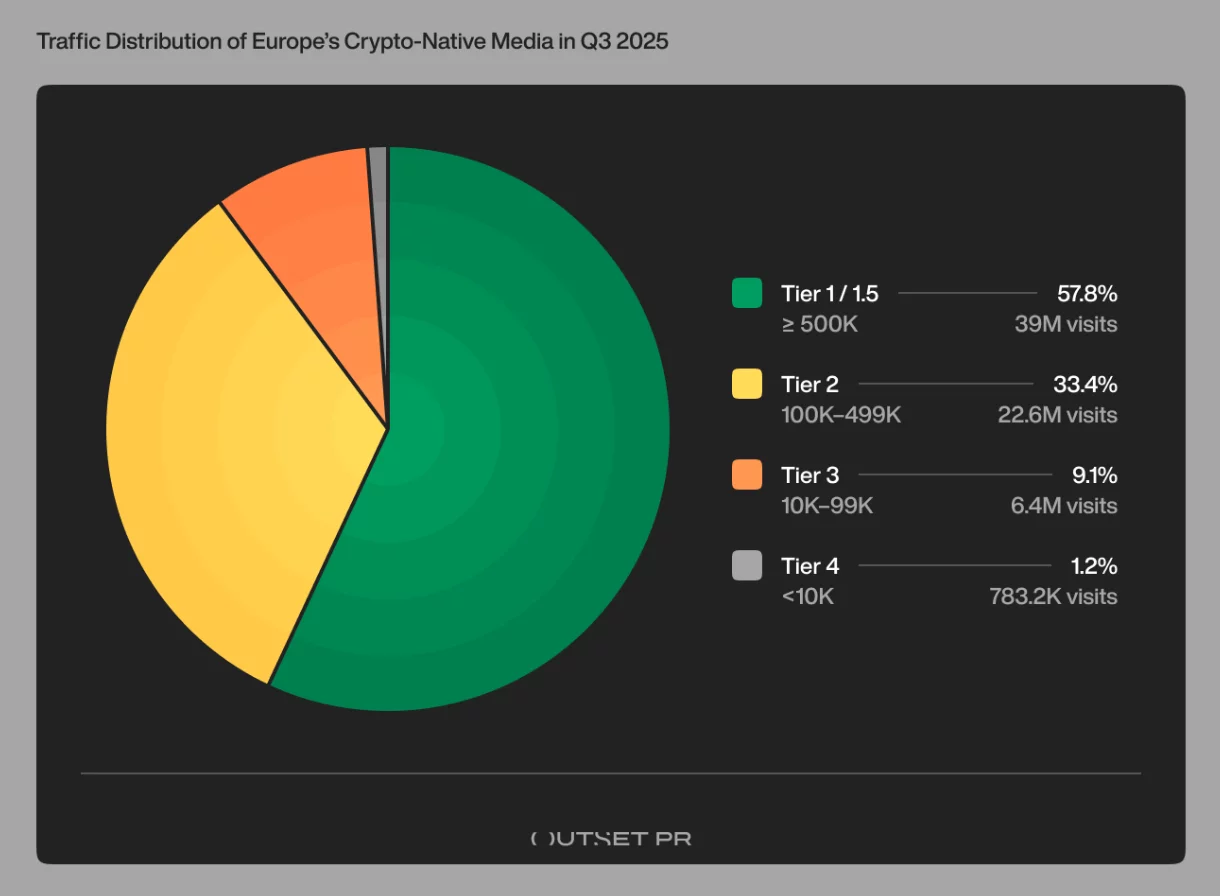
One reason the leaders continue to dominate Europe’s crypto media traffic is the unevenness of the publisher landscape. In Q3, only 12 tier-1 and tier-1.5 outlets accounted for nearly 60% of all crypto-native traffic across Europe. Most of those publishers are based in, or closely tied to, the markets that already sit at the top of the traffic charts.
Below that top tier, the drop is sharp. Tier-2 outlets accounted for about a third of total traffic, while tiers 3 and 4 together accounted for barely more than 10%. Traffic isn’t distributed evenly across publishers, and it’s not distributed evenly across countries either (those two factors tend to reinforce each other).

The short answer to why the same countries keep showing up at the top is scale. Countries that have several large sites pulling steady traffic tend to stay at the top, while markets with fewer scaled outlets don’t build the same momentum.
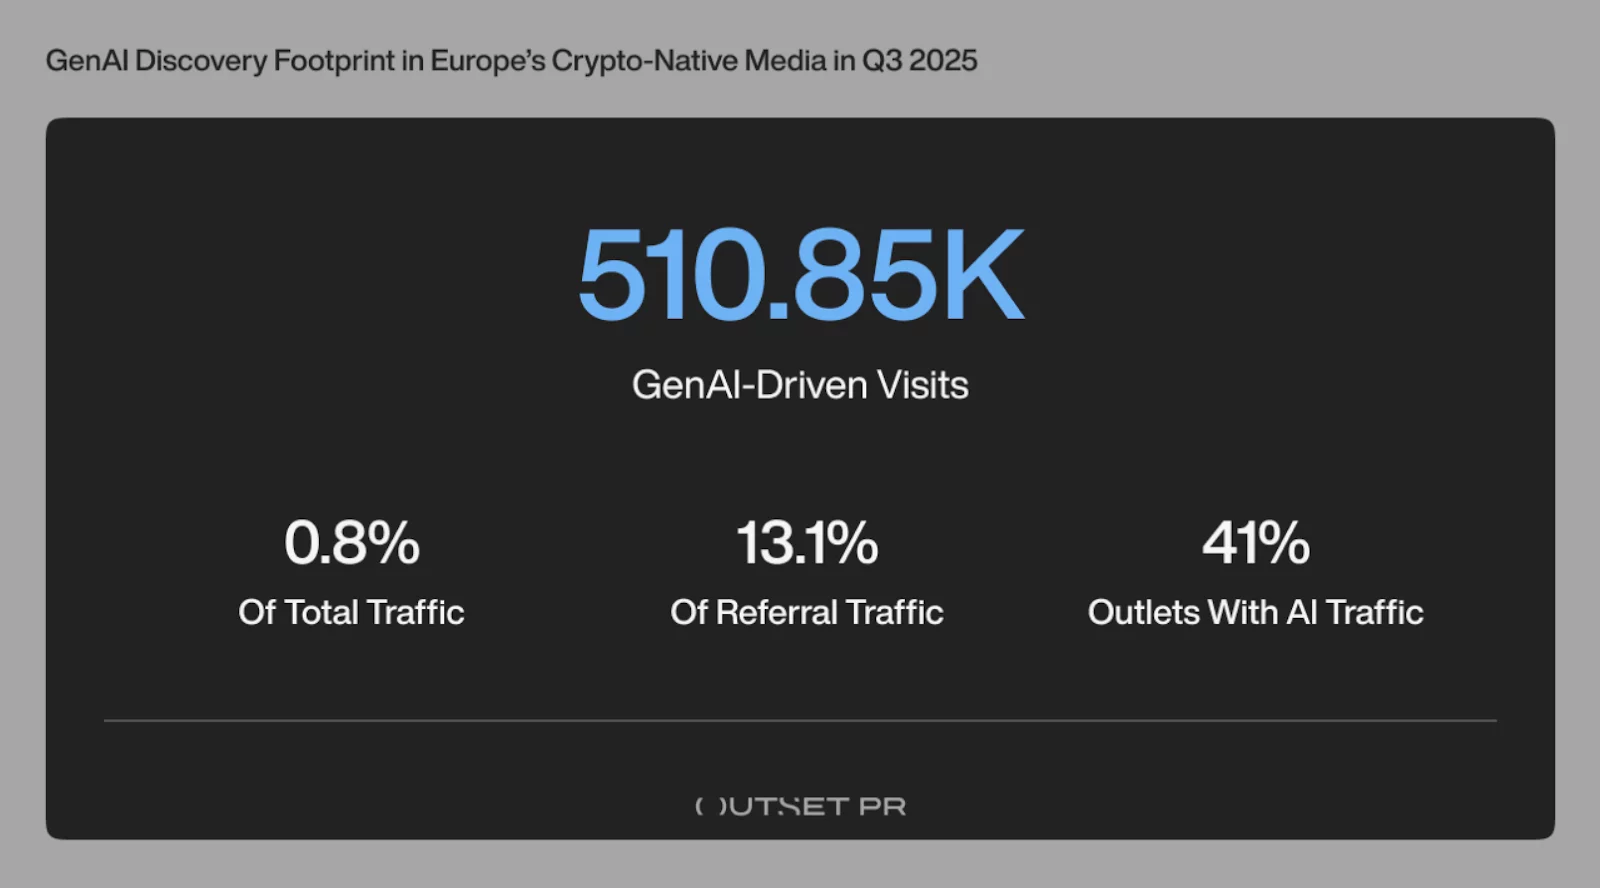
AI wasn’t moving much traffic in Q3
Across the region, AI-driven visits totaled approximately 510,000, representing less than 1% of total traffic, and this pattern held true in France, the Netherlands, Germany, Russia, and Poland.
Where AI began to matter was in referrals. A little over 13% of referral traffic came from AI tools, but that impact wasn’t tied to one country more than another. Instead, it showed up across these top markets at the publisher level.
Larger, tier-1 outlets in countries like France, Germany, and the Netherlands continued to pull most of their traffic from search and direct visits, while mid-sized and smaller outlets within those same countries as well as in Russia and Poland were more likely to see AI-driven referrals, especially when they published evergreen or explanatory content.

How we’re reading Europe’s crypto media after Q3
From our side, Q3 didn’t change much; it mostly confirmed where things already stand. The same countries are still doing the heavy lifting when it comes to crypto media traffic, and that didn’t really move as the quarter played out. Even when volumes moved up or down, it occurred within the same markets.


What’s different now is how little room there is outside those core countries. Traffic didn’t really spill into new places, and smaller markets didn’t suddenly pick up momentum. If you weren’t already operating at scale, Q3 didn’t give you much help.
For us, that makes the takeaway pretty practical. Reaching crypto audiences in Europe is less about broad coverage and more about choosing the right countries and the right outlets inside them. The data makes it clear where results actually come from, and that’s what planning needs to be built around.


