BTC USD is firmly above $110K, and the latest Bitcoin technical analysis at the end of September 2025 is here! Bull markets – everybody loves them! Except the bears, of course… But lets the question circling around lately – Will the Bull market continue or is it over? Where is Bitcoin headed next – should I sell, hold or buy? People who are serious about their finances and consider themselves investors need to make informed decisions when tackling such questions. And they do! One of the areas we get information from is price action and conducting technical analysis.
The most important level in $BTC for half of this year. pic.twitter.com/zihEyLg5OO
— Sam KB (@sam_kb_) September 29, 2025
As always, it is really healthy to fill the picture with other trusted traders’ thoughts. In this case, with Sam’s comment on how crucial the $112,000 level has been lately.
DISCOVER: Best Meme Coin ICOs to Invest in 2025
And without further ado, let us dig into the charts!
How is BTC USD Shaping Up For October? Bitcoin End of Month Technical Analysis
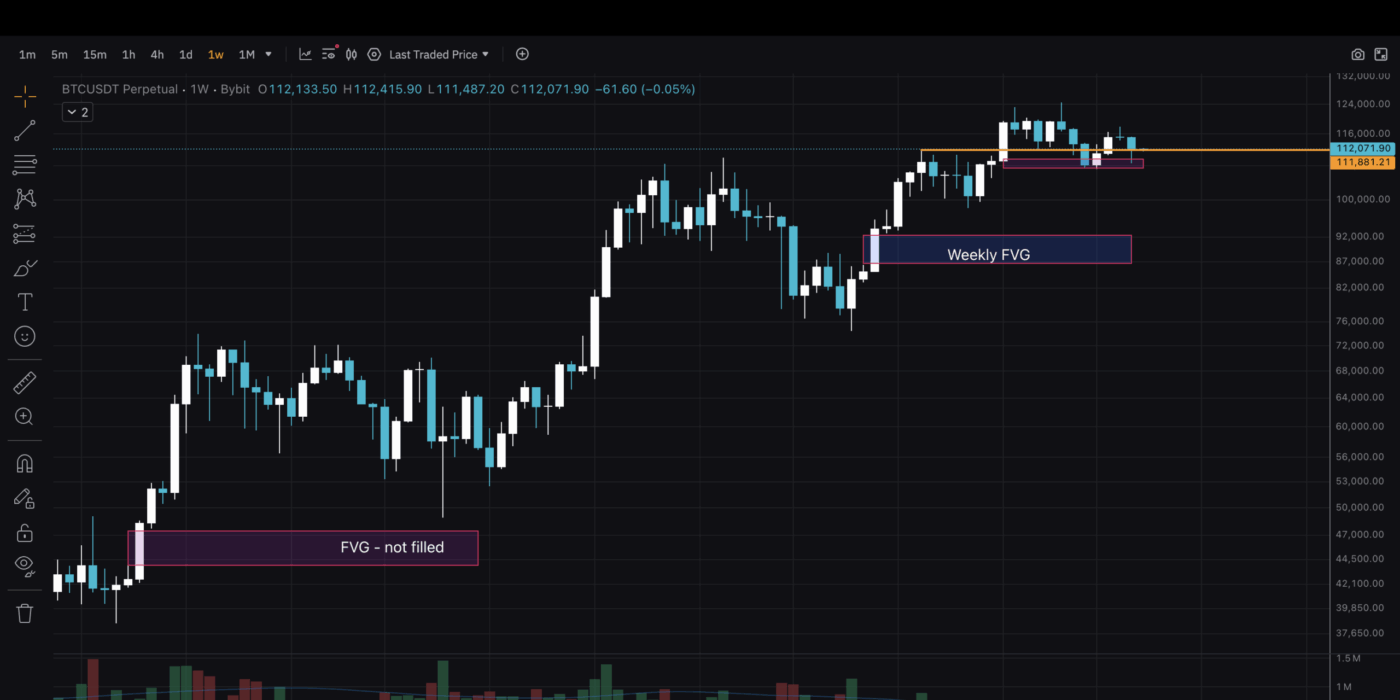
(Source, TradingView – BTCUSD)
1W timeframe – a good place to begin! Not to take too long here, we would like to notice that in February of 2024 and April of 2025 there are Weekly Fair Value Gaps. Both remain unfilled. I would rather say the 2024 is unlikely to get filled during this bull market. And the higher the price holds above $100,000, the less likely it becomes for the 2025 gap to be filled.
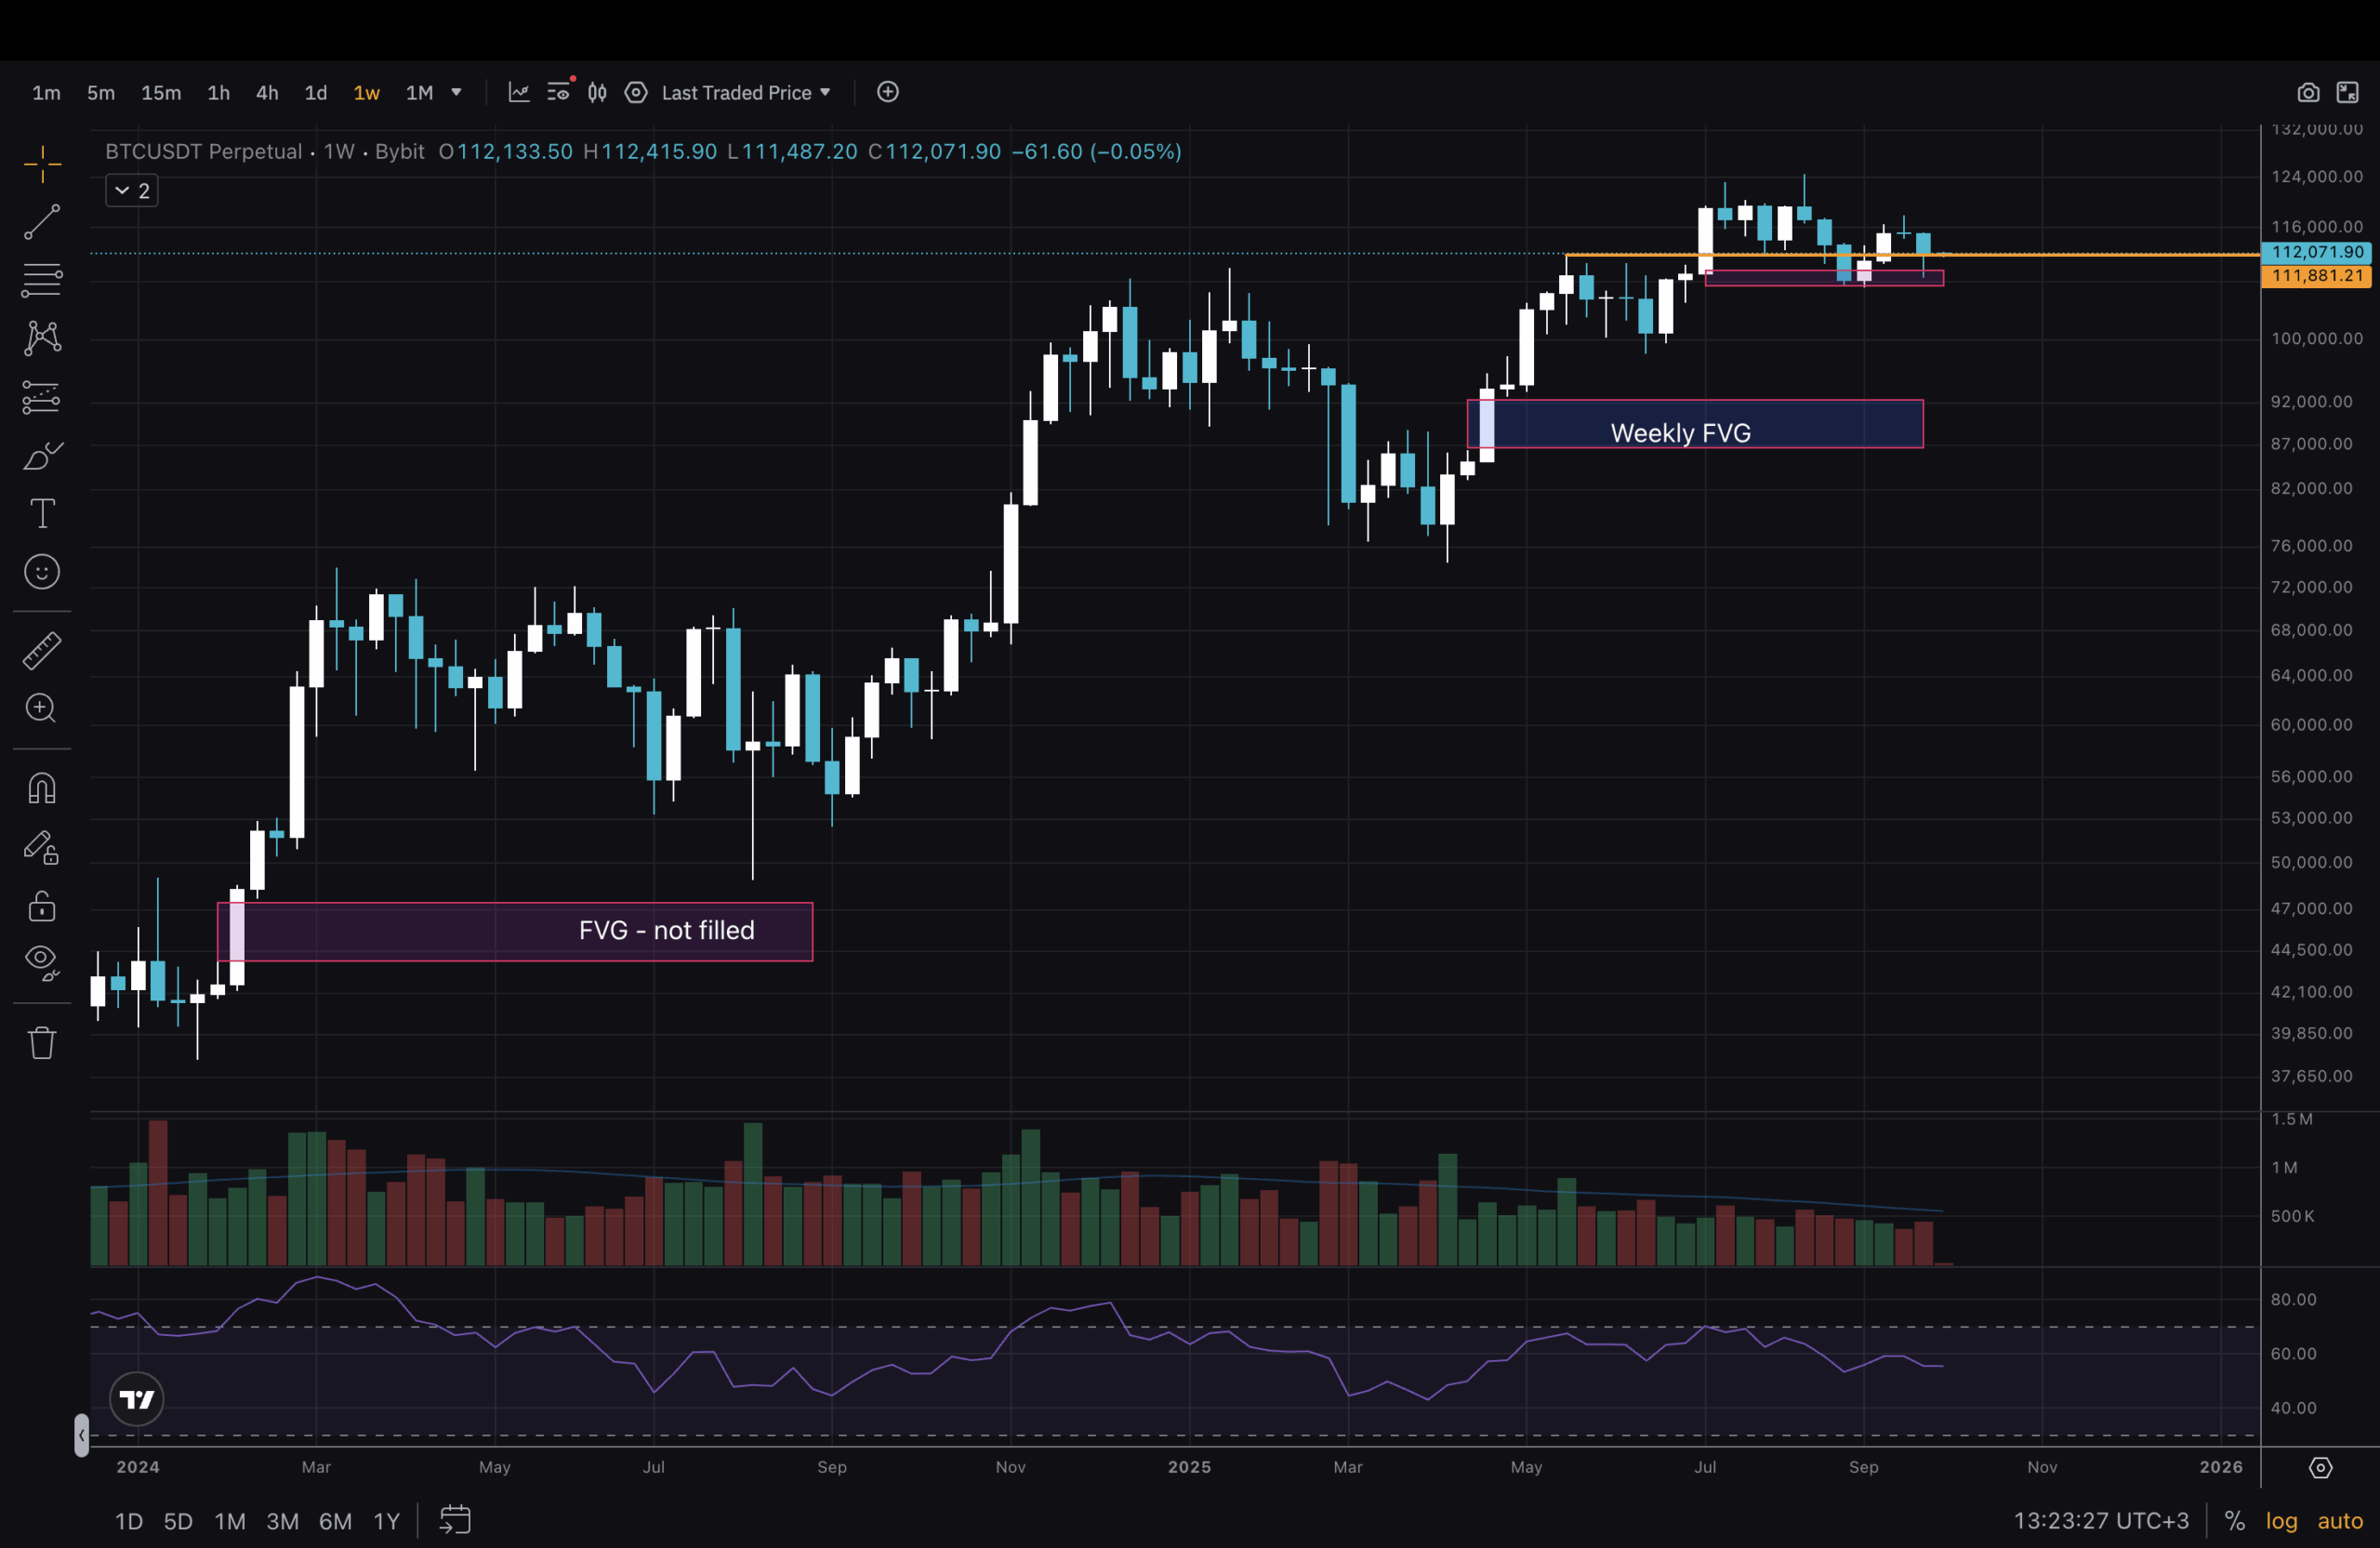
(Source – TradingView, BTCUSD)
Going back to Sam’s comment on the importance of $112,000 level for Bitcoin price analysis, on this chart it is the orange line. And what is important here, besides that level, is last week’s candle. Half of the candle is a body, and half of it is a wick, with the wick being underneath that key level. This, by itself, could be a sign of strength!
DISCOVER: Top Solana Meme Coins to Buy in 2025
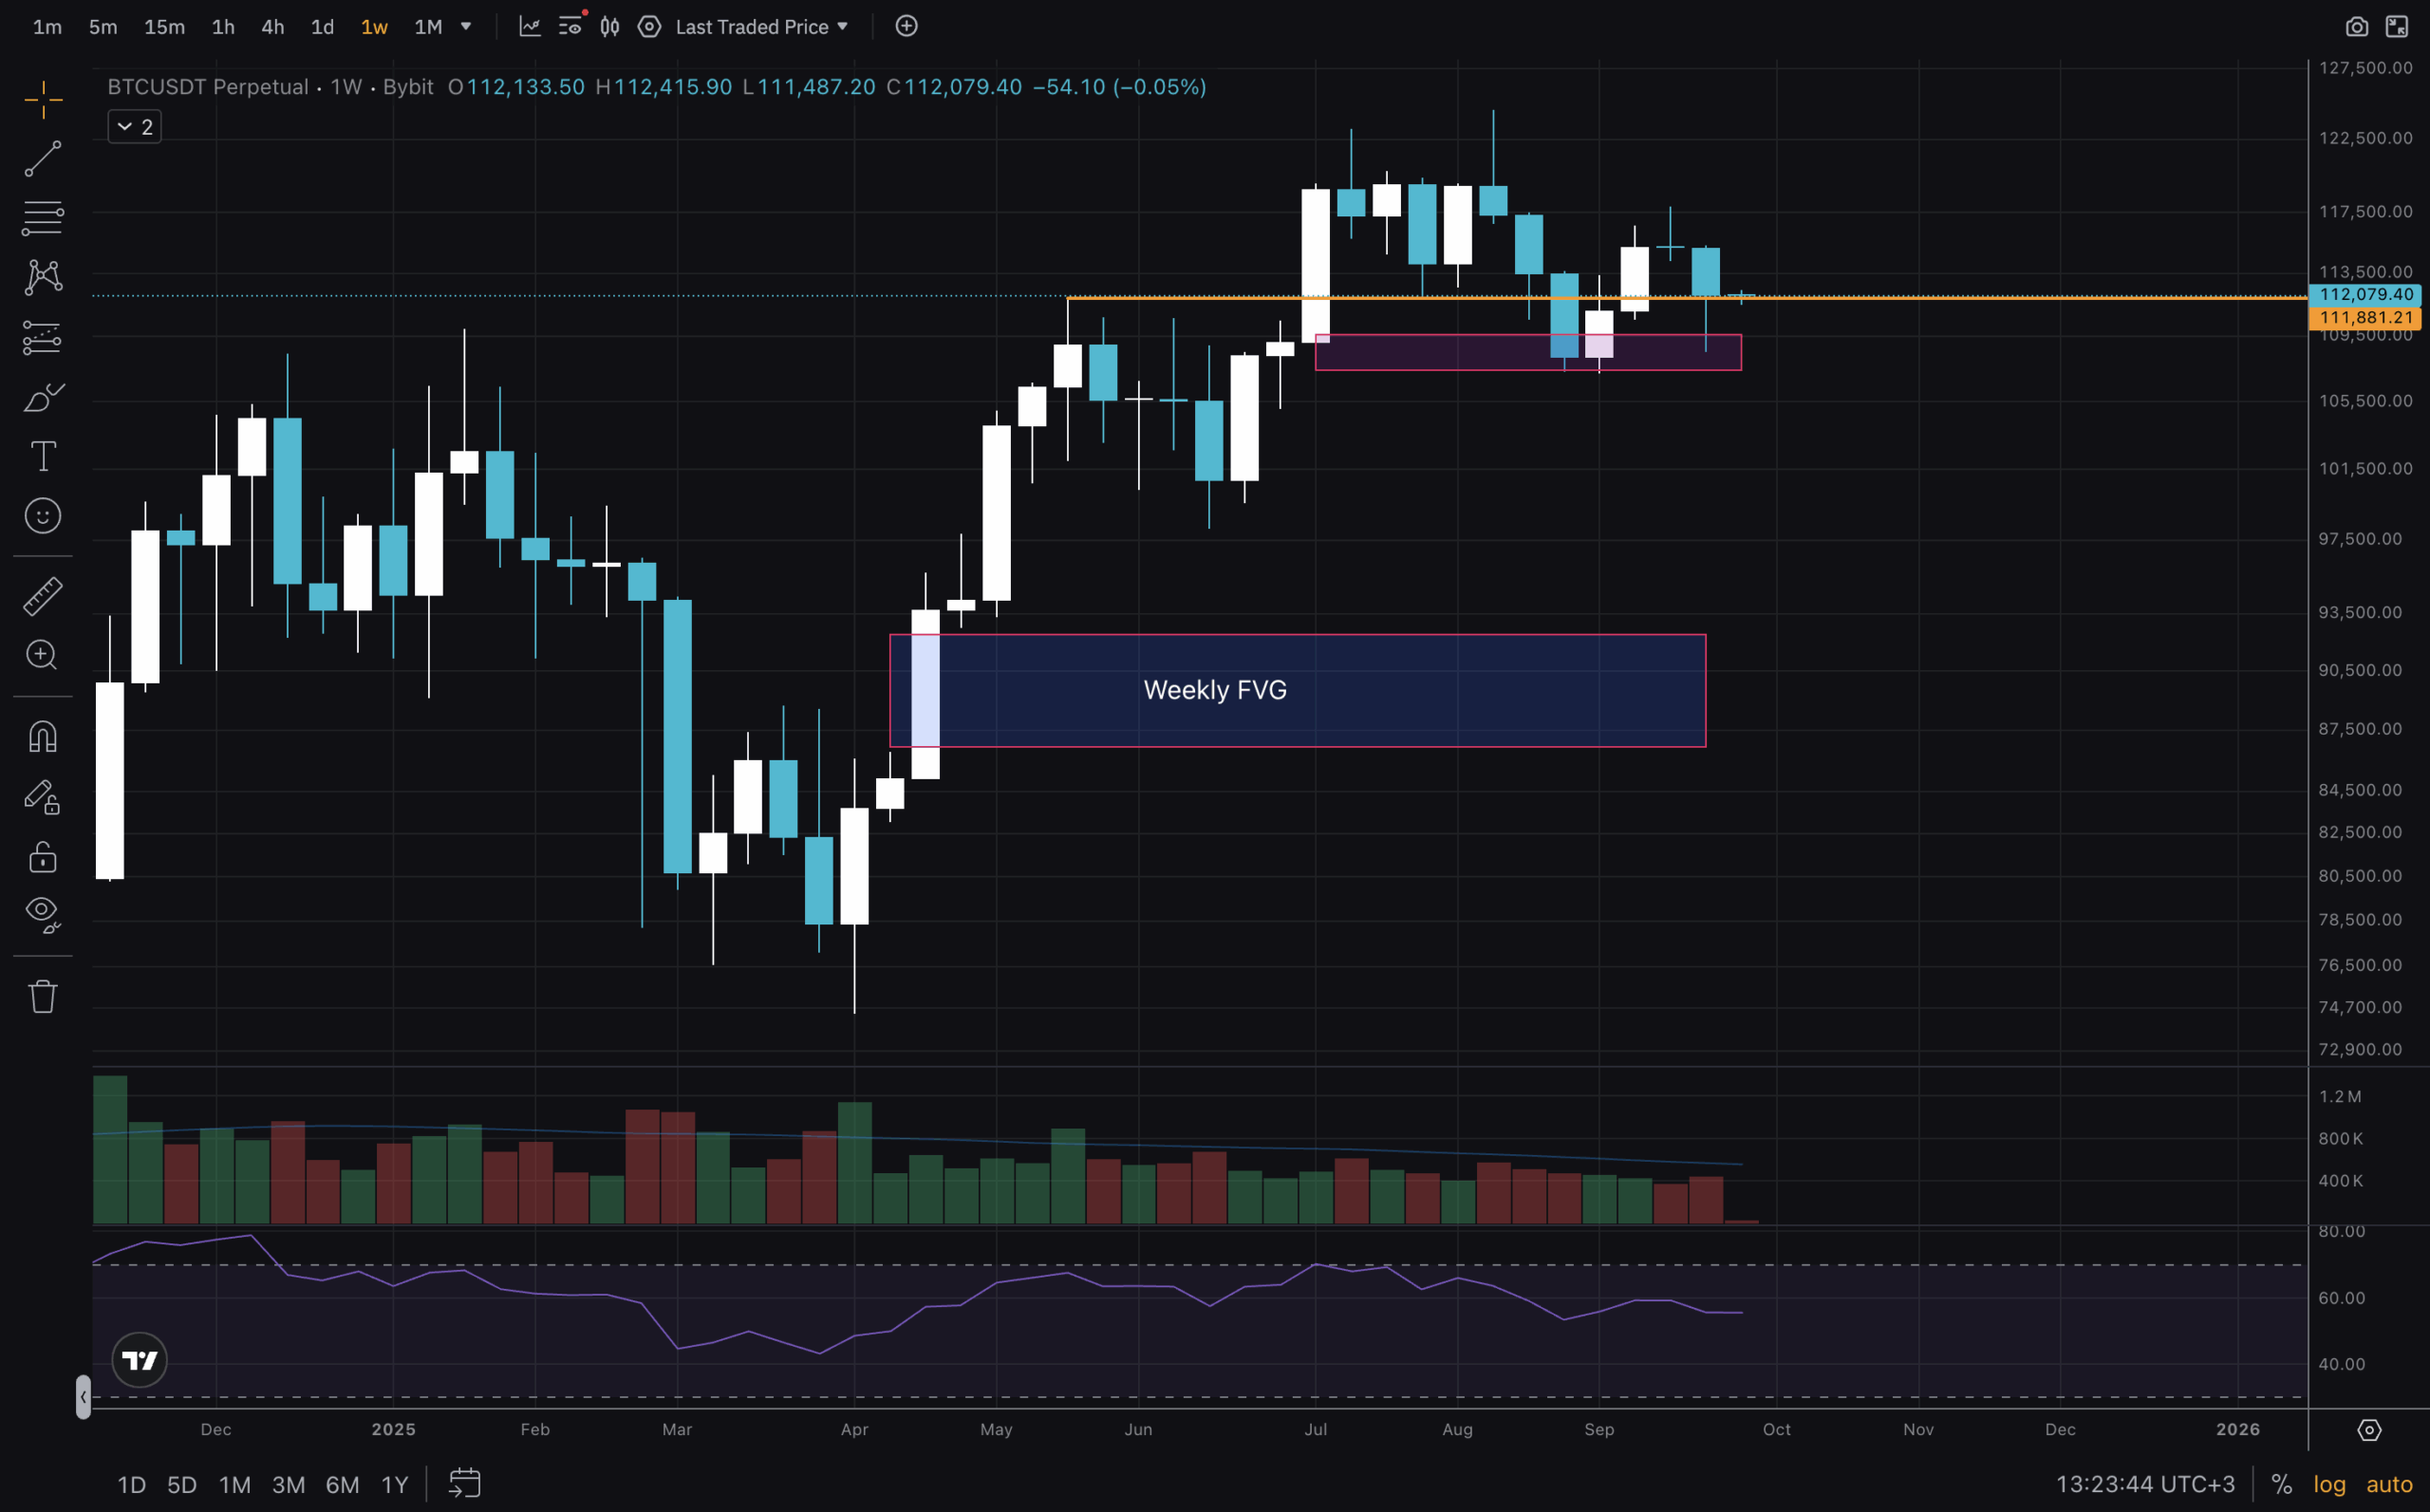
(BTCUSD)
Zooming in on the 1D chart, another marker for an uptrend and support are the moving averages. Currently, the BCT USD price is below MA50 and MA100, with MA50 about to go under MA100 – not great. But MA200 is still underneath at which is a strong and important level. The other details will be discussed in more detail below.
DISCOVER: Top 20 Crypto to Buy in 2025
Zooming in On BTC USD: Bitcoin Technical Analysis on Lower Timeframe + Conclusions
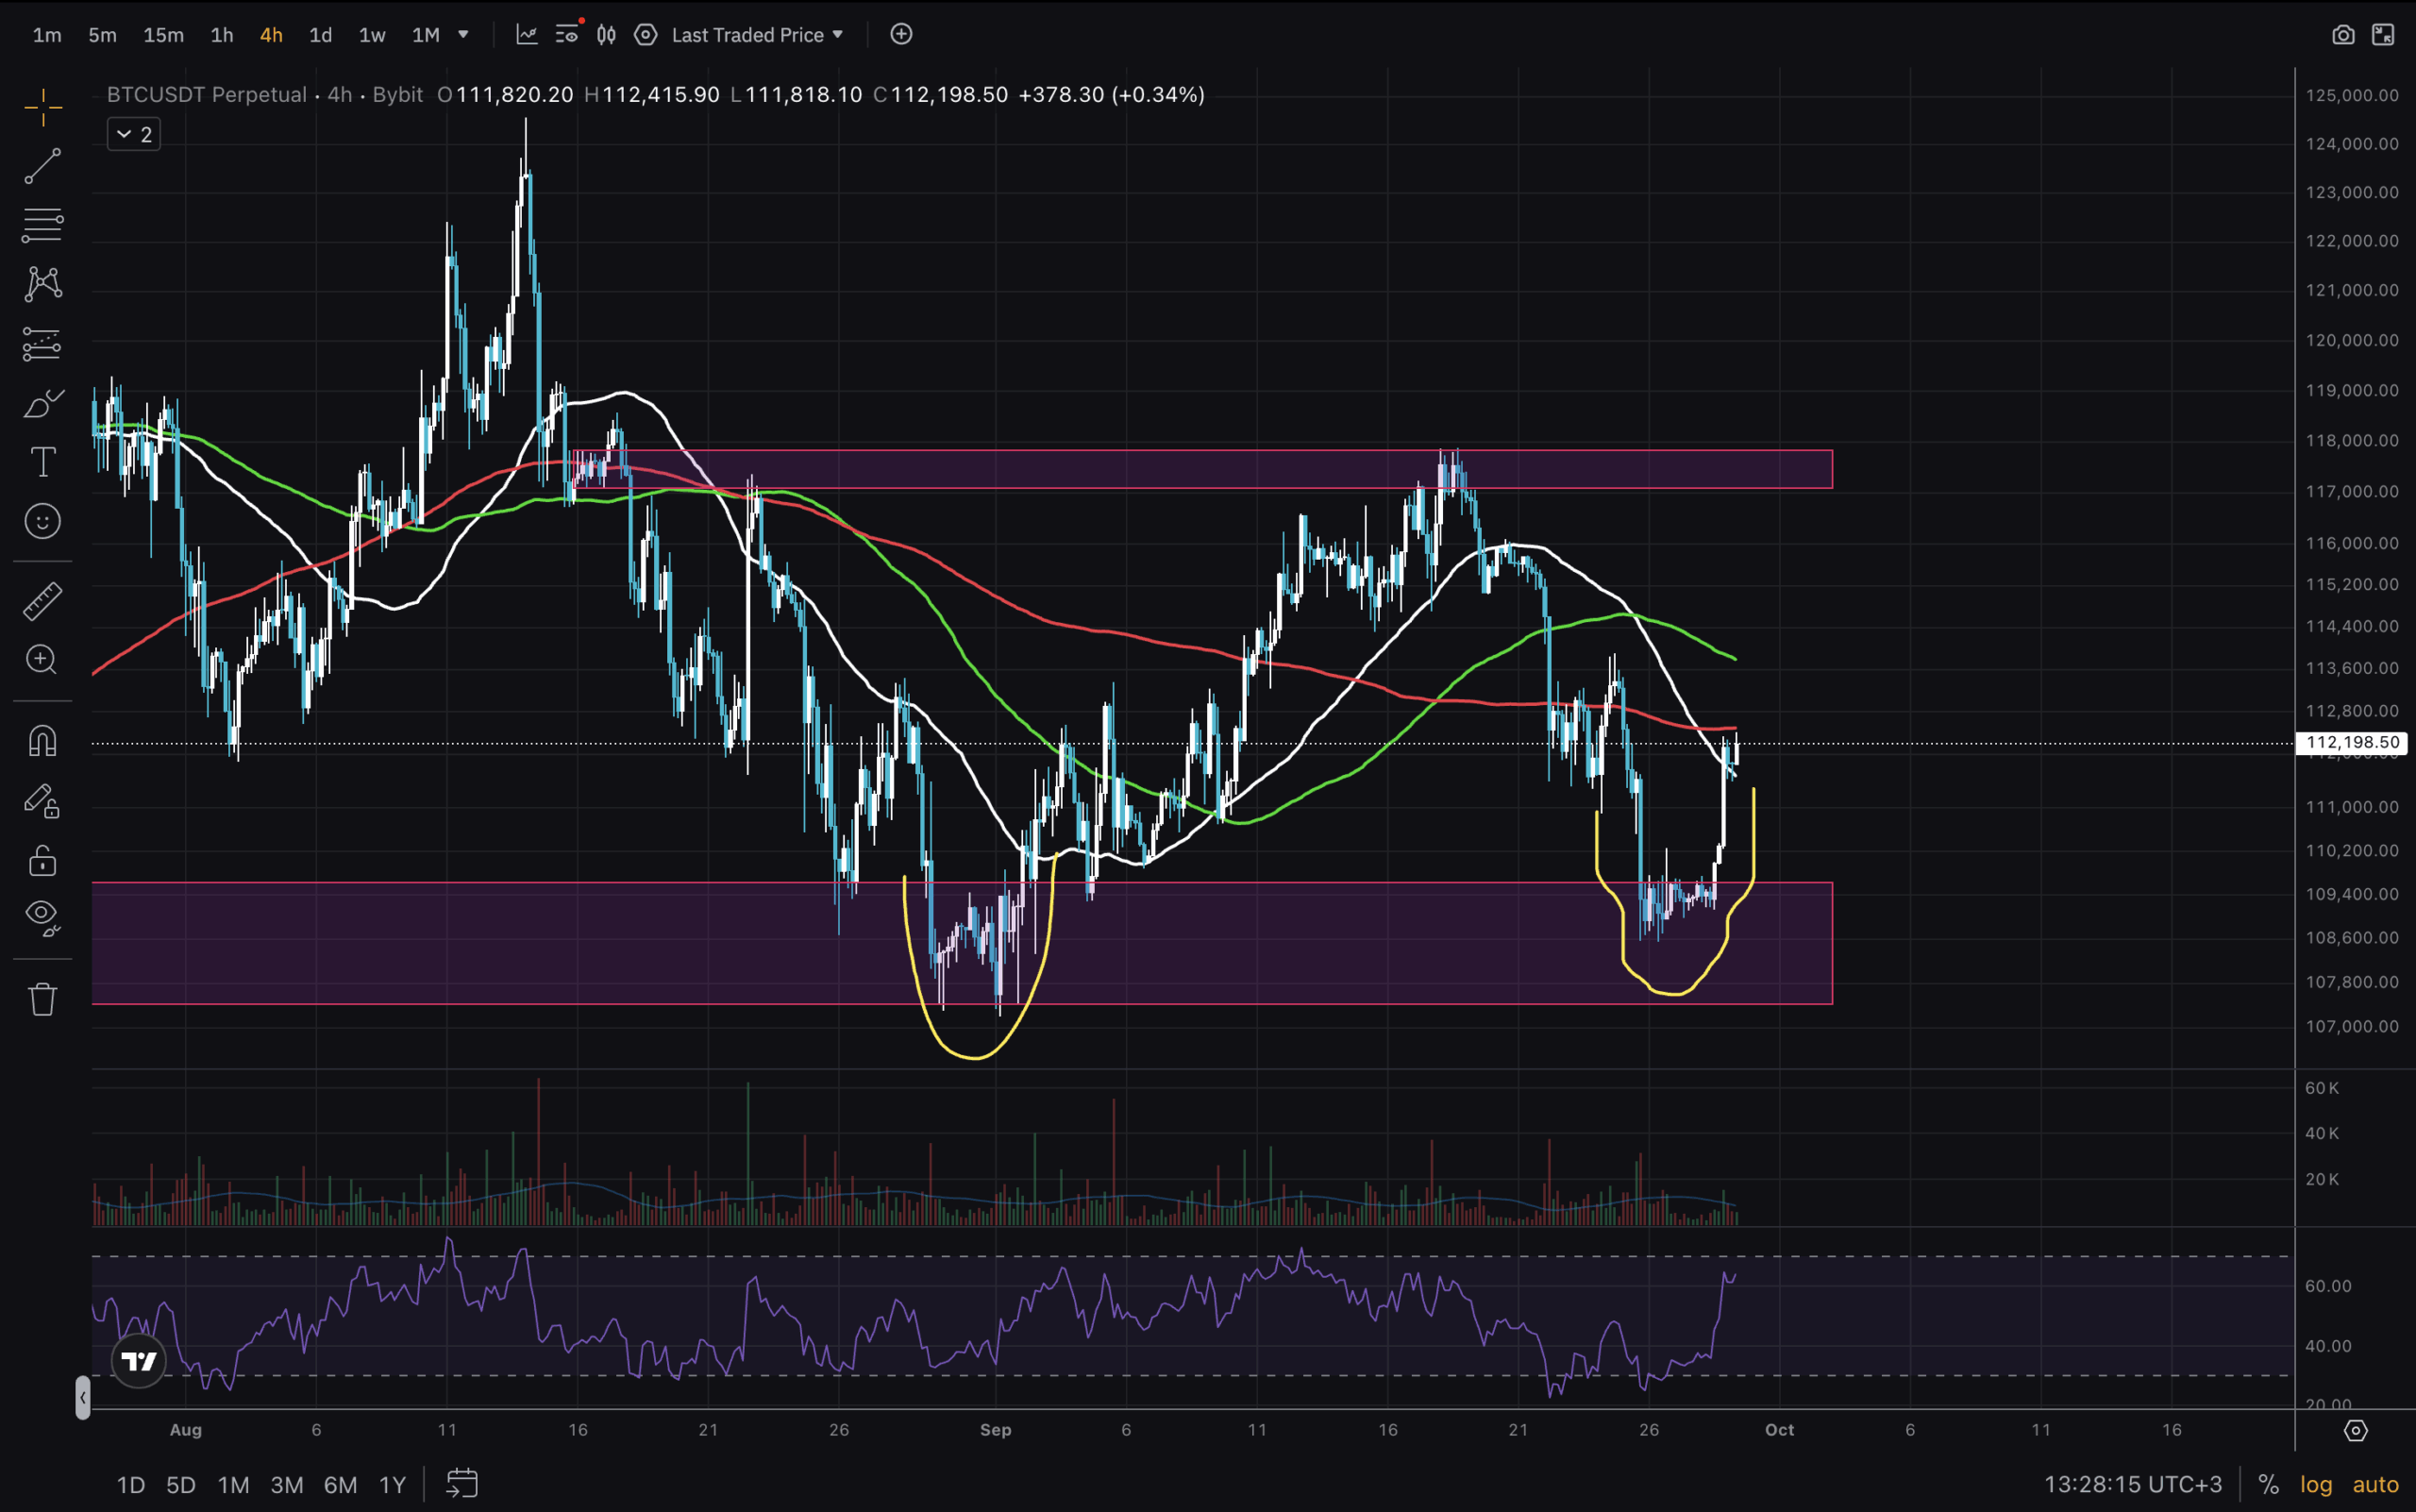
(BTCUSD)
On the 4H I have adjusted the left yellow bounce zone to the bottom one, which I considered a deviation. If it were, the BTC USD price wouldn’t go this far down a second time.
This makes this zone more of a demand/liquidity support area. Essentially, we have a $10k range between $108,000 and $118,000. The last high that touched the resistance zone is actually a Higher High on this lower timeframe, and now we are moving up from a Higher Low. That is a good start!
Bulls want to see all Moving Averages reclaimed and then a clean break above that $118,000 key level. Trade safely!
DISCOVER: Next 1000X Crypto – Here’s 10+ Crypto Tokens That Can Hit 1000x This Year
Join The 99Bitcoins News Discord Here For The Latest Market Updates
Bitcoin Technical Analysis: End of September 2025 Insights
- Key level to hold is $110,000 – $112,000
- 1D chart shows bearish factors, yet structure remains bullish
- Expect price to be choppy around Monthly close
- Key level to reclaim for upward continuation is $118,000.
The post BTC USD Targets End of September: Bitcoin Technical Analysis for October appeared first on 99Bitcoins.


