Dogecoin has fallen to its lowest level in years after a decisive breakdown from a multi-year head-and-shoulders pattern added fresh selling pressure during the latest crypto market rout.
Summary
- Dogecoin price has broken below a multi-year head-and-shoulders neckline, putting the meme coin under renewed bearish pressure.
- Crypto analyst Ali Martinez says DOGE is testing key channel support, with $0.1019 and $0.1156 acting as recovery targets if buyers step in.
- A breakdown below the current support zone could expose the next major downside level near $0.067.
According to crypto.news data, Dogecoin (DOGE) price traded near $0.081 on June 6 after losing more than 20% over the past week. The decline came as Bitcoin briefly slipped below the key $60,000 level, triggering heavy liquidations across the digital asset market and pushing the Crypto Fear & Greed Index deeper into Extreme Fear territory.
Additional pressure has emerged from derivatives markets. Recent crypto-wide liquidation events erased billions of dollars in leveraged positions, with long traders accounting for the majority of forced closures.
Open interest across major crypto assets has also contracted sharply as traders reduced risk exposure during the selloff.
On-chain data, however, presents a different picture. As crypto.news reported earlier this week, analytics platform Alphractal said Dogecoin had returned to a historically important accumulation zone between $0.10 and $0.11 before breaking lower. The firm noted that DOGE was trading near the lower boundary of its CVDD Channel, a model designed to identify long-term value areas based on coin age and transaction value.
Alphractal argued that similar zones have appeared before major Dogecoin recoveries in previous market cycles. The firm also described the current structure as a period of quiet absorption rather than aggressive distribution, despite weak sentiment across the meme coin sector.
A multi-year head-and-shoulders breakdown dominates the chart
The weekly chart now shows one of the largest bearish formations in Dogecoin’s history. Price has completed a head-and-shoulders pattern that developed over more than two years, with the left shoulder forming in early 2024, the head near the late-2024 peak around $0.48, and the right shoulder during the second half of 2025.
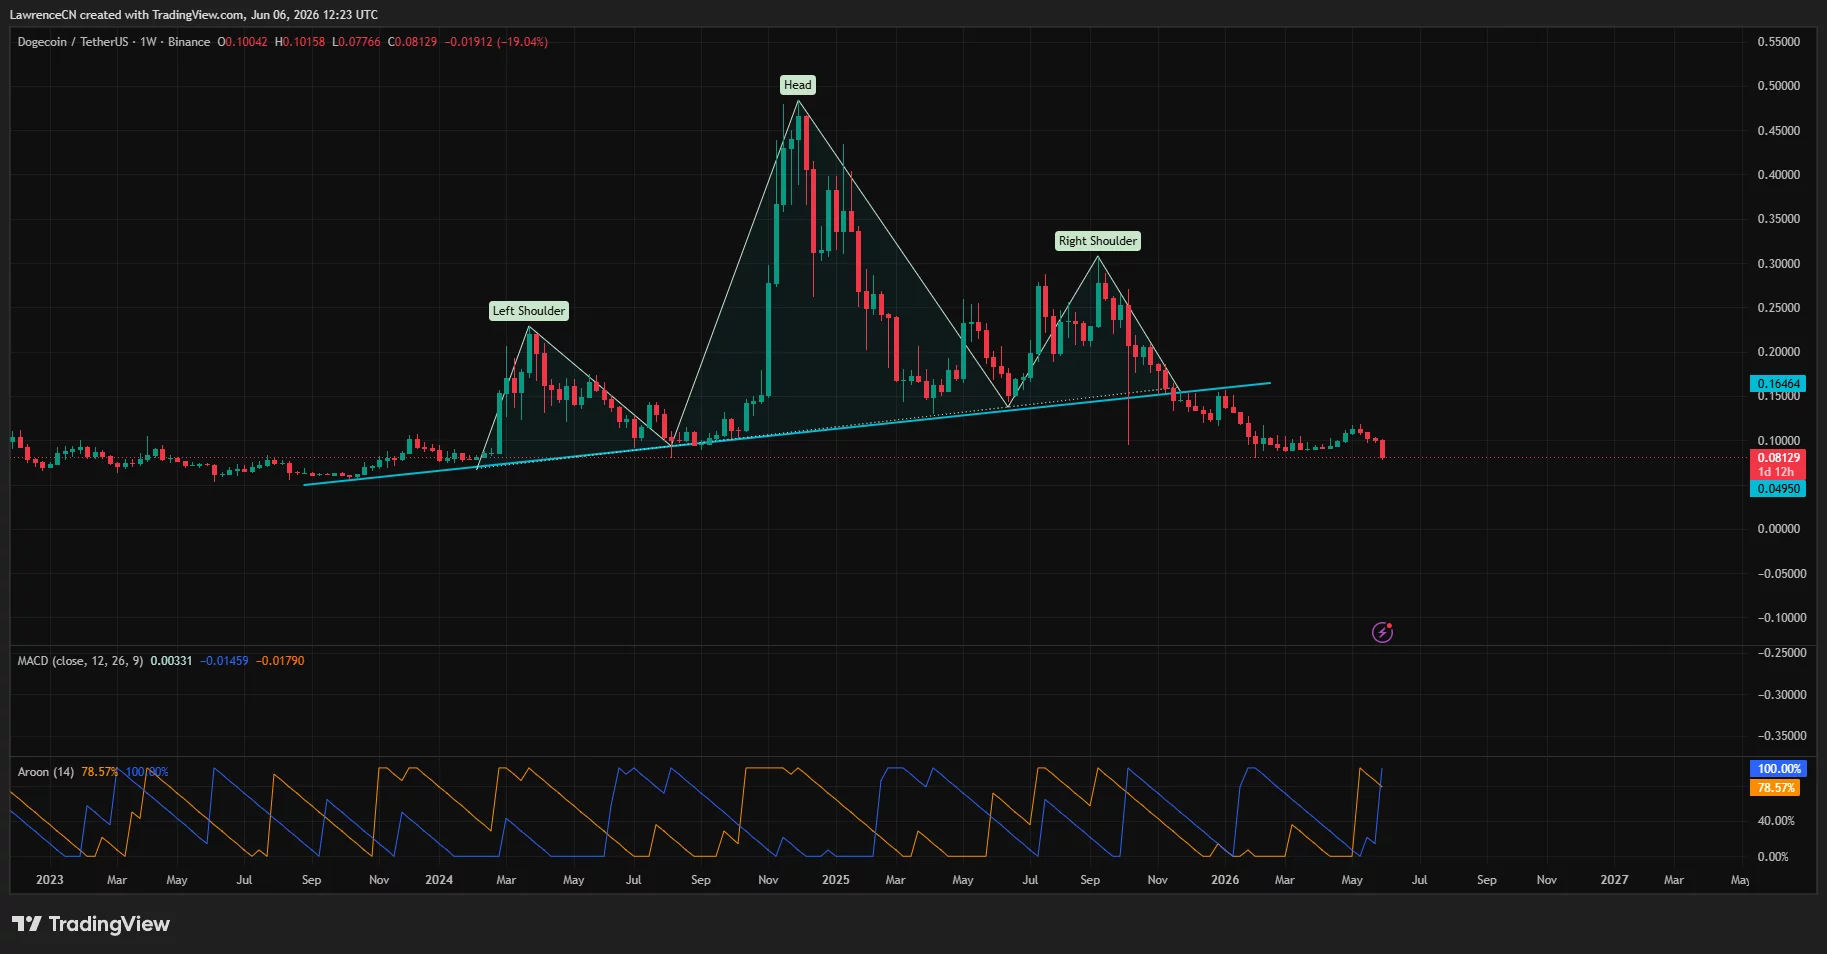
DOGE broke below the ascending neckline earlier this year and has failed to reclaim it during subsequent rallies. The former support line near $0.16 has now turned into resistance, leaving sellers firmly in control of the longer-term trend.
Momentum indicators remain weak. The weekly MACD remains below its signal line, while the price continues to trade far beneath major moving-average clusters that supported previous bull cycles. At the same time, the Aroon structure on the weekly timeframe continues to favor the dominant downtrend.
Commenting on the market structure, crypto analyst Ali Martinez noted that Dogecoin has already reached the $0.0883 target and is now testing the lower boundary of a descending channel.
“As long as this support holds, I think a recovery toward $0.1019 and $0.1156 remains likely,” Ali wrote.
Support near $0.08 becomes the key battleground
The most immediate support now sits around the current $0.08 region. Losing that level would expose the psychological $0.067 area identified by Ali as the next major supply-demand zone below the market.
Failure to hold $0.067 could increase the probability of a move toward the long-term structural support area near $0.05, which aligns with historical consolidation levels seen before Dogecoin’s 2024 breakout.
Bulls still have a path to invalidate the bearish setup. A recovery above $0.10 would place DOGE back inside Ali’s projected rebound zone, while a move above the broken neckline near $0.16 would weaken the head-and-shoulders breakdown thesis and force traders to reassess the long-term trend.
For now, the weekly chart remains tilted toward further downside as Dogecoin trades beneath both the neckline and its former accumulation range.
Disclosure: This article does not represent investment advice. The content and materials featured on this page are for educational purposes only.