

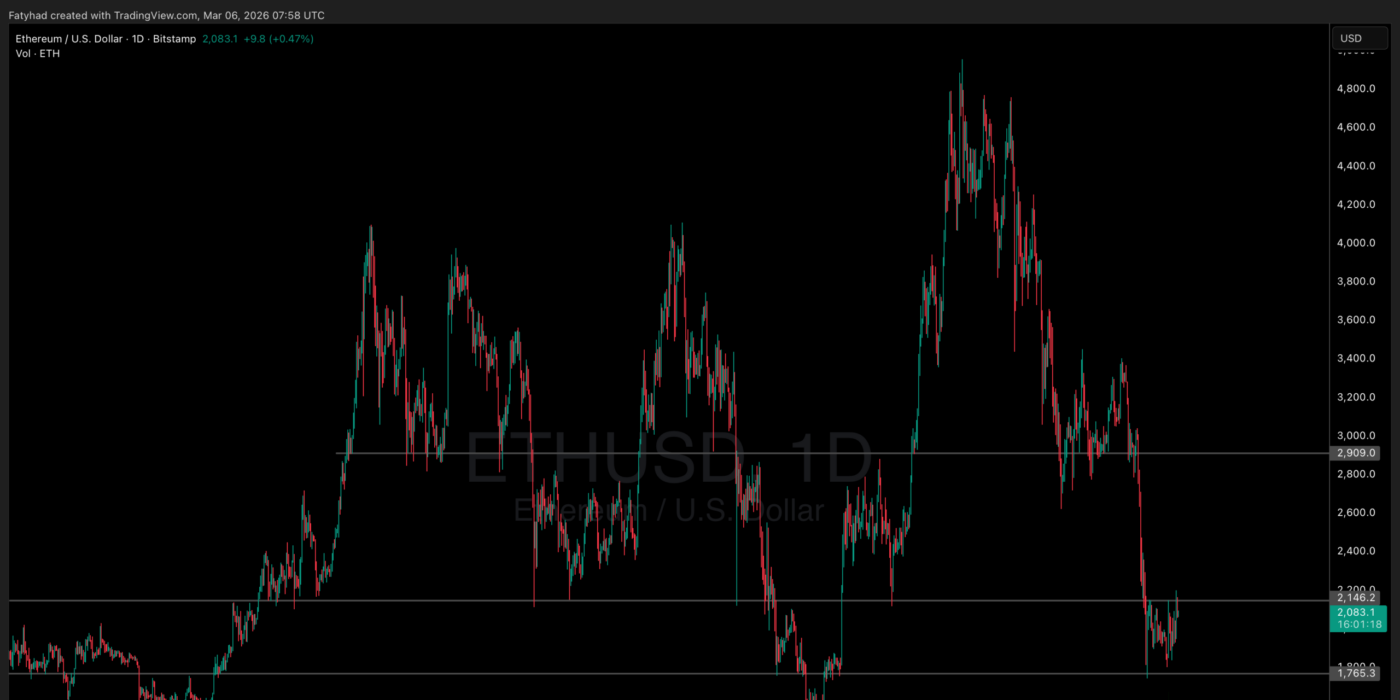
ETH price is sitting at a critical crossroads after six consecutive months of red candles, leaving investors wondering if the pain is finally over or just taking a breath. While a historic purchase by Harvard University has injected fresh confidence into the market, the charts are painting a conflicting picture of potential explosive growth versus a devastating fakeout. Retail traders are paralyzed, watching ETH hover around $2,067, unsure if this is the start of a massive recovery or a trap set for the overly optimistic.
The bullish case is building around a classic reversal pattern that could send prices soaring toward $2,800 if immediate resistance breaks. However, the risk of a brutal bull trap remains high, with technical indicators warning that a rejection here could flush the price back down to $1,750 or lower.
Is this the moment to accumulate, or is patience the only way to avoid becoming exit liquidity for the whales?
DISCOVER: Top Crypto Presales to Watch Now
ETH Price Analysis: The $2,150 Resistance That Bulls Need to Break

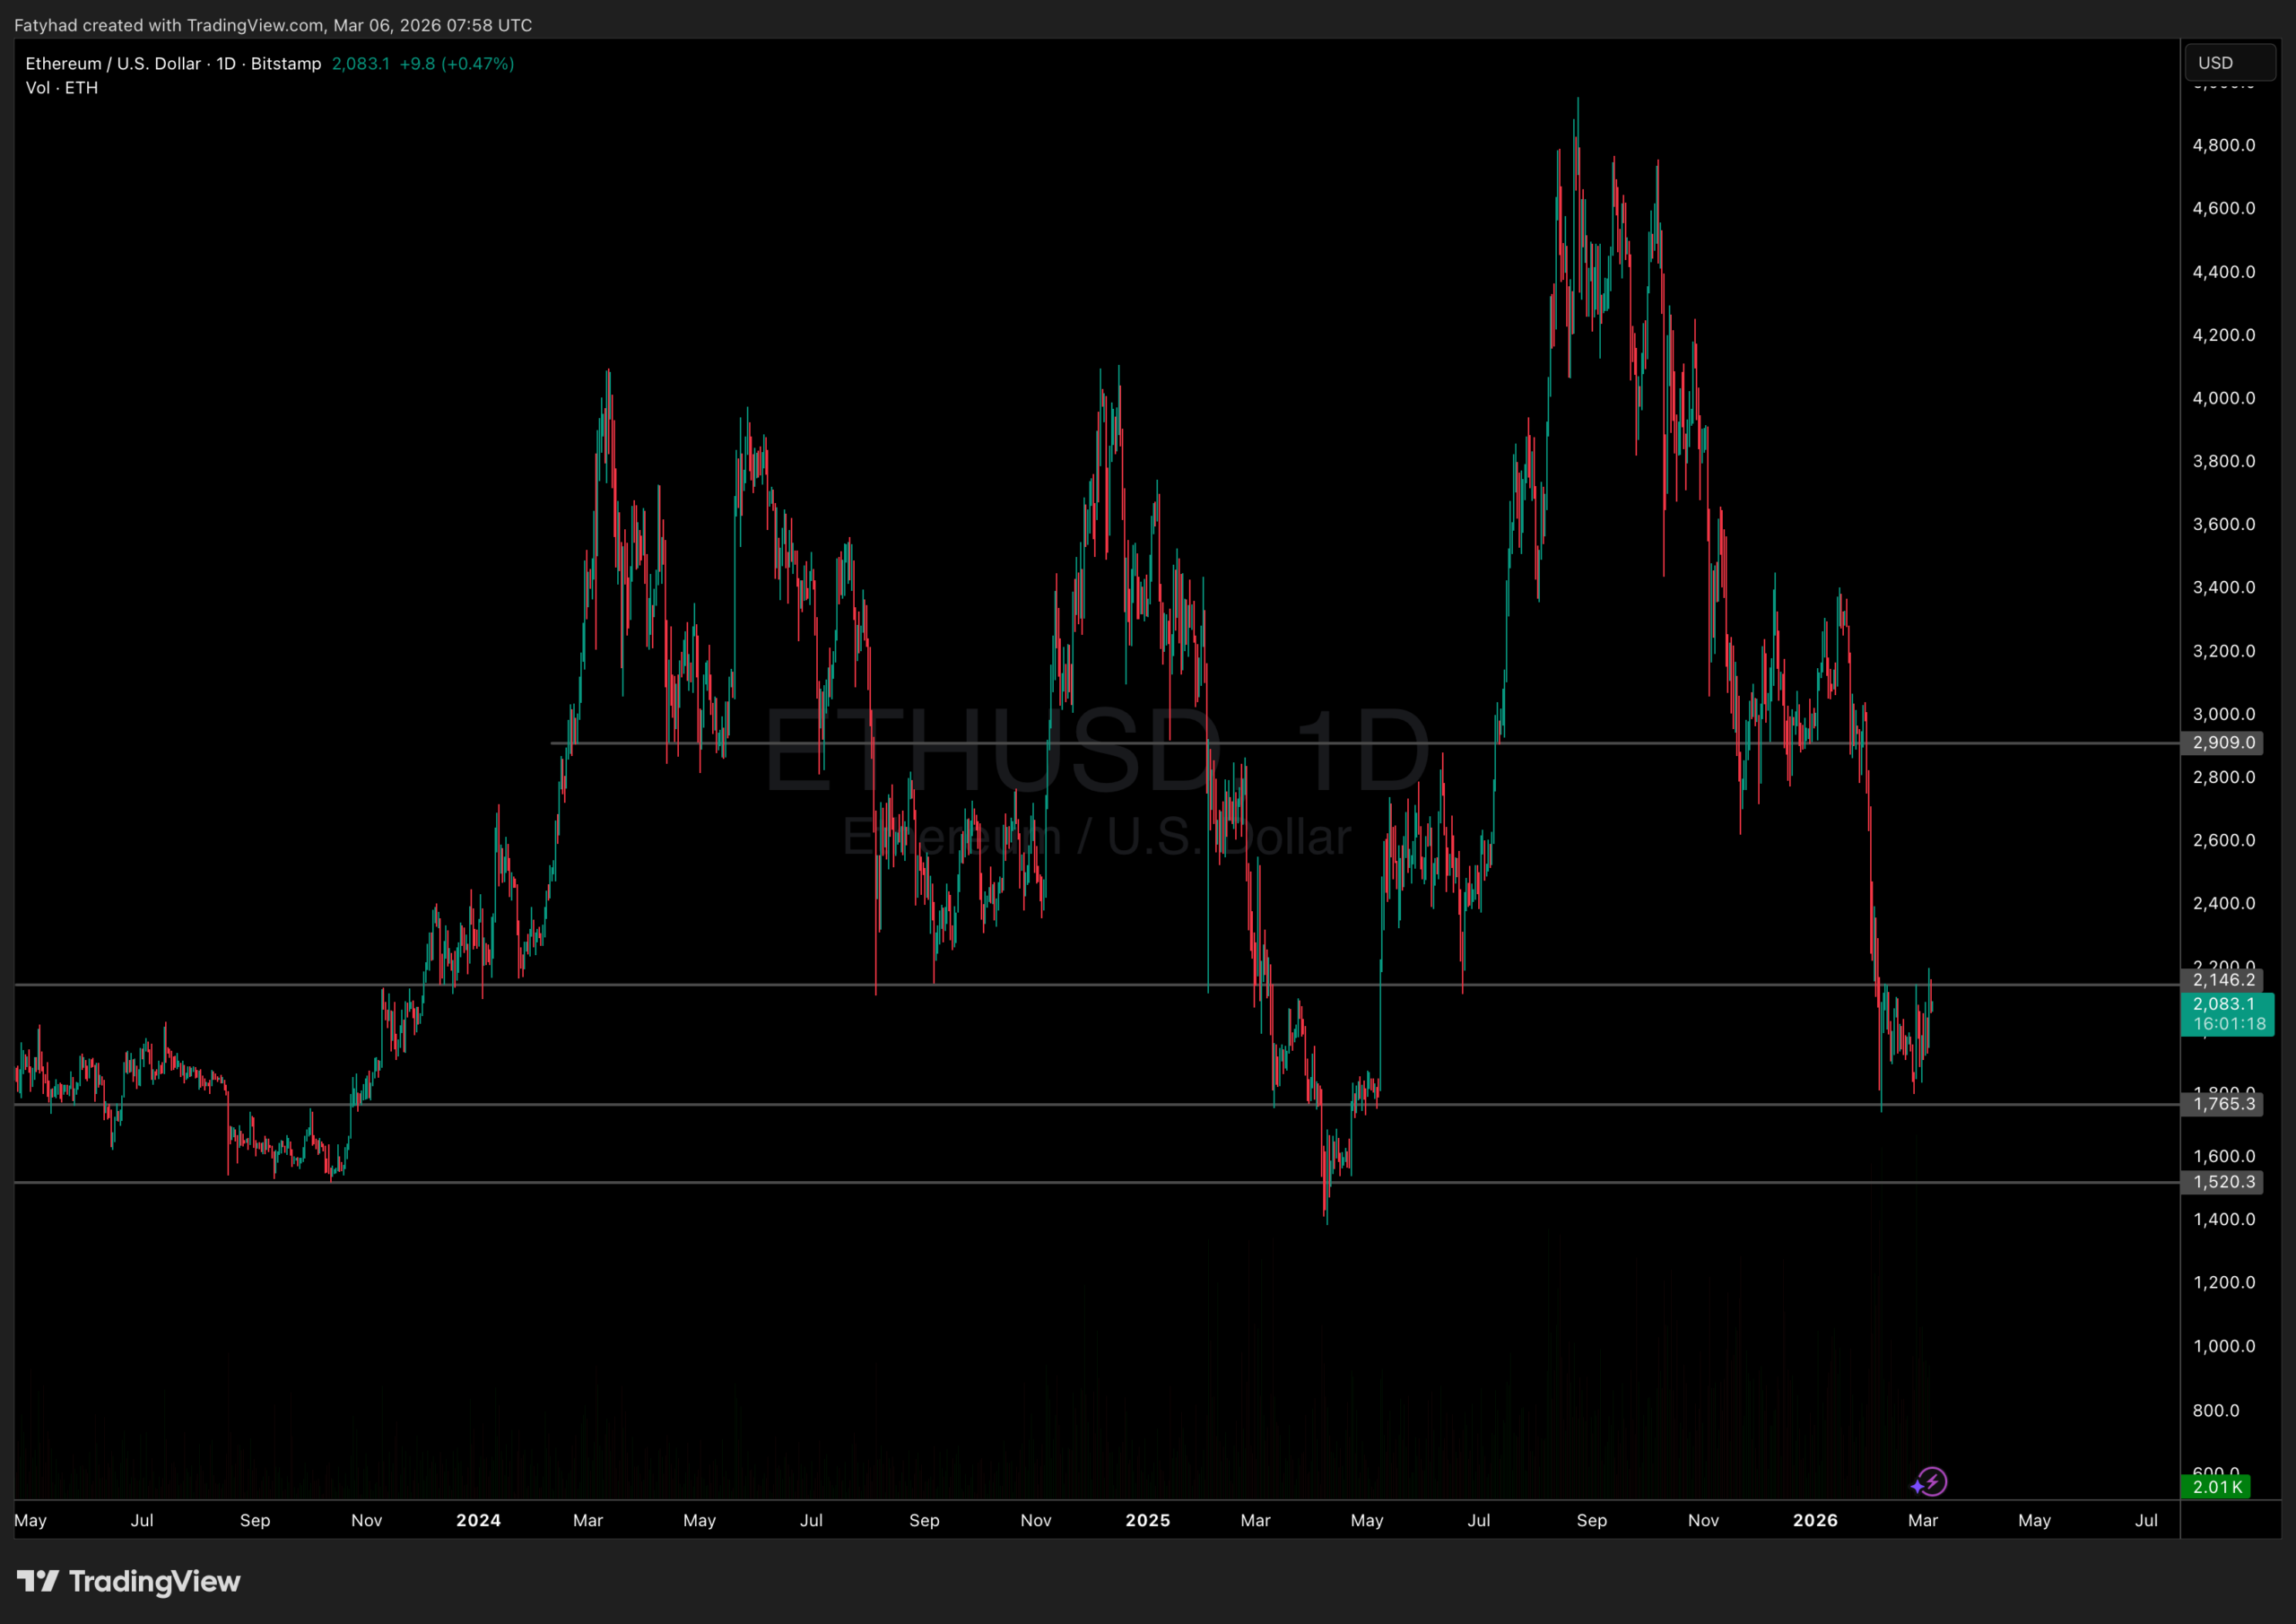
Bulls are currently staring down a massive wall of resistance between $2,140 and $2,160. If the Ethereum price can close a daily candle clearly above $2,150, it triggers a “measured move”: a technical target derived by adding the height of the pattern to the breakout point. In this scenario, a confirmed breakout could launch the price quickly toward $2,800, catching many sidelined traders by surprise.
This bullish view is supported by the $2,150 support level analysis, which highlights how previous resistance often flips into new support. If volume spikes as the price approaches this level, it would confirm that the big players are pushing for a breakout, potentially validating the ambitious price prediction at $3,000+ by March.
The Bull Trap Risk: What Could Push ETH to $1,500
$ETh needs to stay above purple pic.twitter.com/rAZcPf0yTr
— Conquerooor
KA (@ConquererCrypto) March 6, 2026


For ETH, not only breaking $2150 and holding above it is a strong reversal signal, but also a breakdown below $1,935 would expose the market to a harsh reality. Without that support, the next major floor is the lower Bollinger Band around $1,700. If panic selling accelerates, the charts point to a potential slide all the way down to $1,500. This would effectively trap anyone who bought the premature hype, forcing them to sell at a loss and driving the price even deeper. Traders should watch the volume closely; a breakout on low volume is often a trap in disguise.
DISCOVER: 5 High-Risk High-Reward Cryptos
The Macro Context: Institutions vs. Retail Anxiety

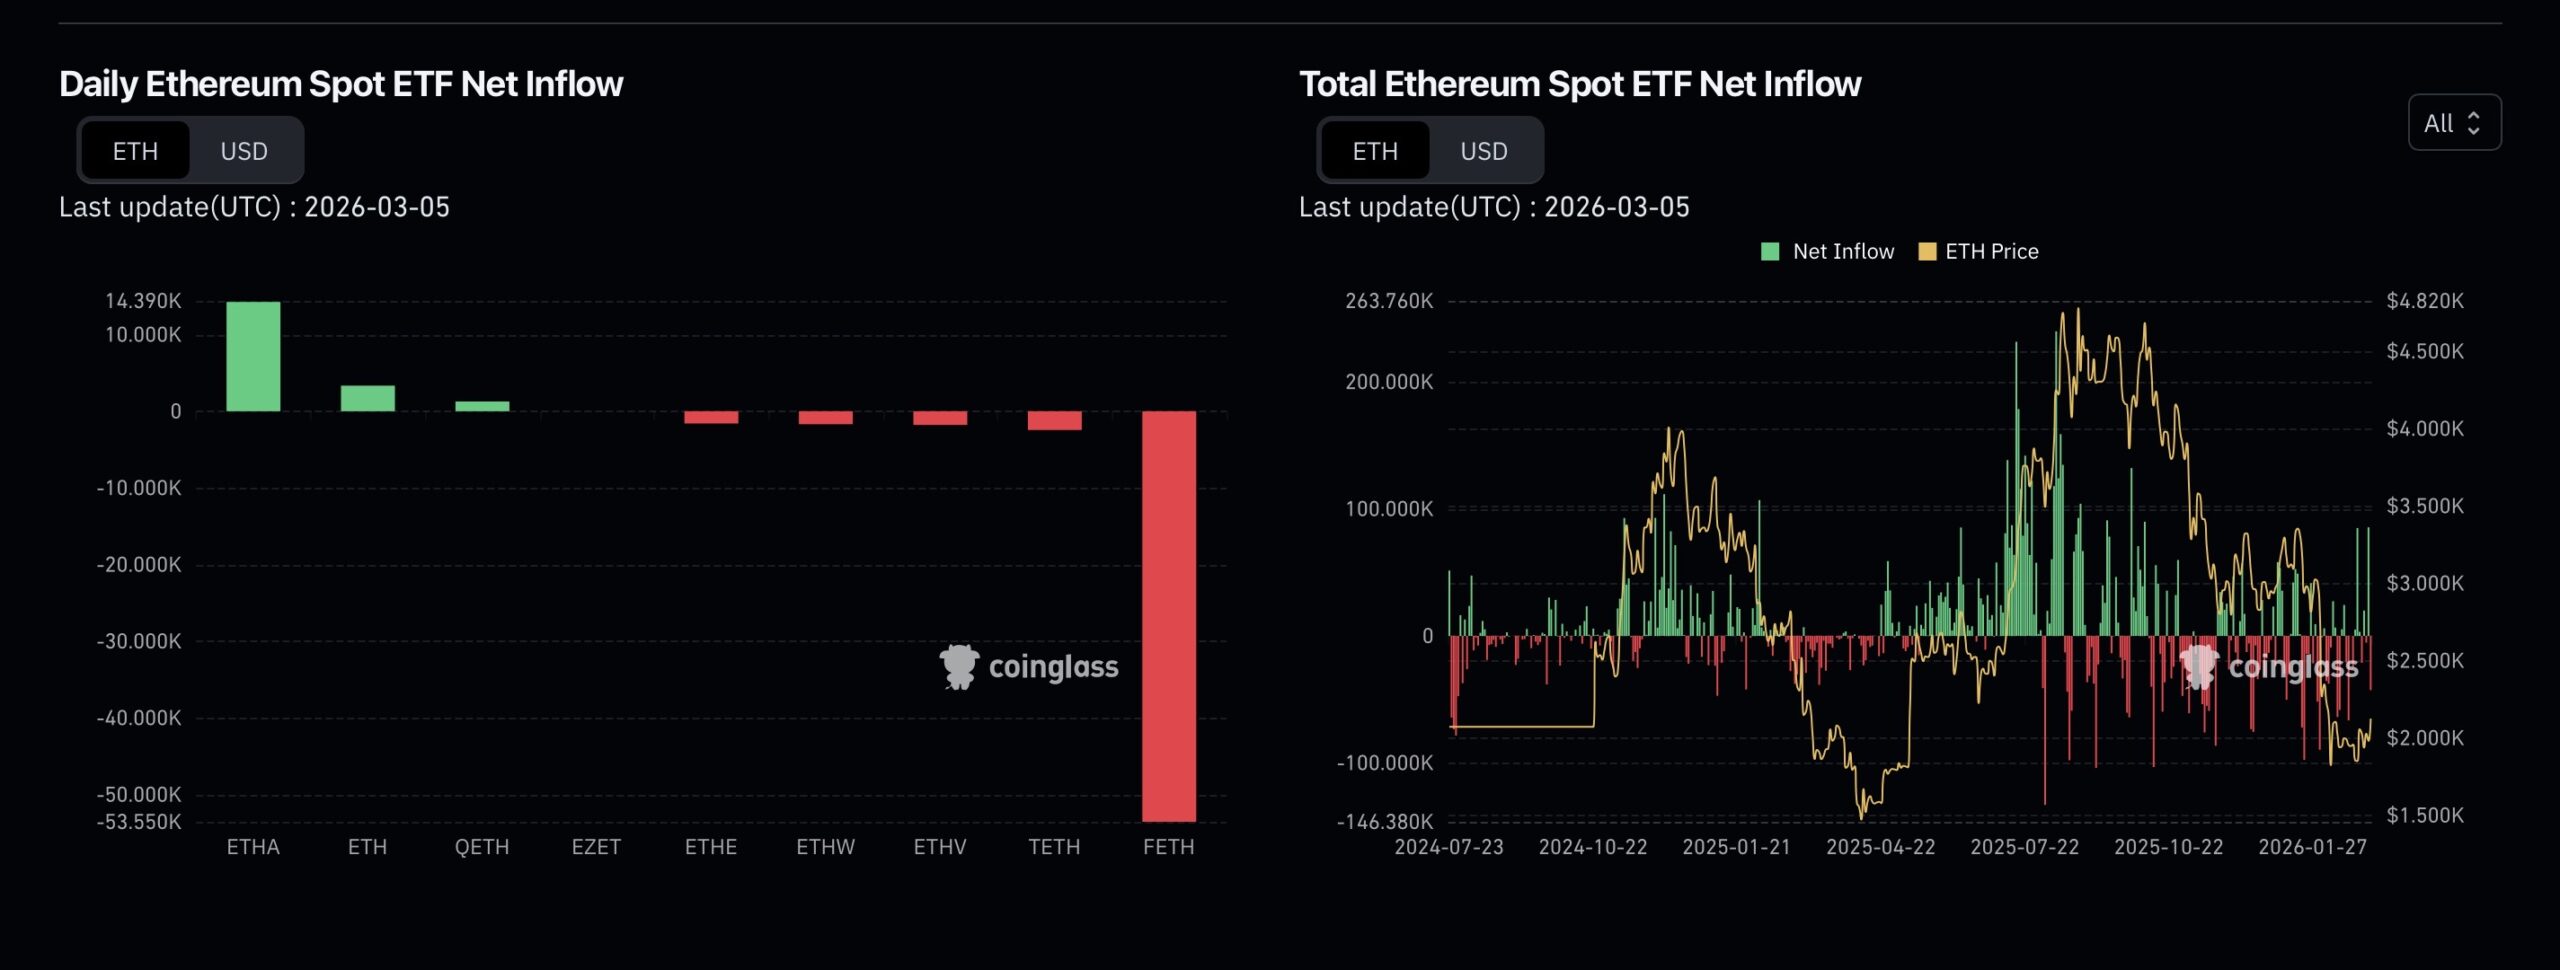
ETH ETFs have been showing mixed but generally positive signals recently. On March 4, inflows surged to a record high of $169 million, the largest daily total in two months. By March 5, flows were modestly positive again at around $22.7 million, once more led by BlackRock.
However, yesterday’s flow registered a net negative of $90 million, indicating that sentiment isn’t entirely bullish at the moment.
The Standard Chartered Ethereum price prediction of $7,500 suggests that major banks are looking far beyond the current chopping action, focusing instead on long-term value accrual from Layer-2 networks and institutional adoption.
The Harvard University purchase in early 2026 serves as a massive psychological anchor. It suggests that while the price action is ugly, the asset class is maturing into a staple for diversified portfolios.
The market is currently waiting for a decisive move: either the institutions overpower the sellers to reclaim the trend, or the broader economic fears drag the ETH price down for one final flush.
DISCOVER: Next Possible 1000x Crypto in 2026
Follow 99Bitcoins on X (Twitter) For the Latest Market Updates and Subscribe on YouTube For Daily Expert Market Analysis.
The post ETH Price at a Crossroads: Bull Trap or Last Cheap Entry? appeared first on 99Bitcoins.


