


HYPE price rose to $55.60 after defending the $51 support zone, with stronger capital inflows and a descending-channel breakout supporting the recovery.
Summary
- HYPE price rebounded 8.2% from its recent low near $51.
- 4-hour price action broke above a descending channel and $54.29 Supertrend.
- The daily chart places initial resistance between $57.28 and $58.14.
- Liquidation liquidity is concentrated around $56.20–$57.00, creating a potential short-squeeze target.
HYPE price rebounds from $51 support
According to data from crypto.news, HYPE price traded around $55.60 on Aug. 4 after rising as high as $55.80 during the latest session. The token has gained roughly 8.2% since bouncing from the $51 area, where buyers defended a support zone established during previous market corrections.
The rebound followed an extended decline from HYPE’s July highs above $72. On the 4-hour chart, the token had been forming lower highs and lower lows inside a descending channel since mid-July.

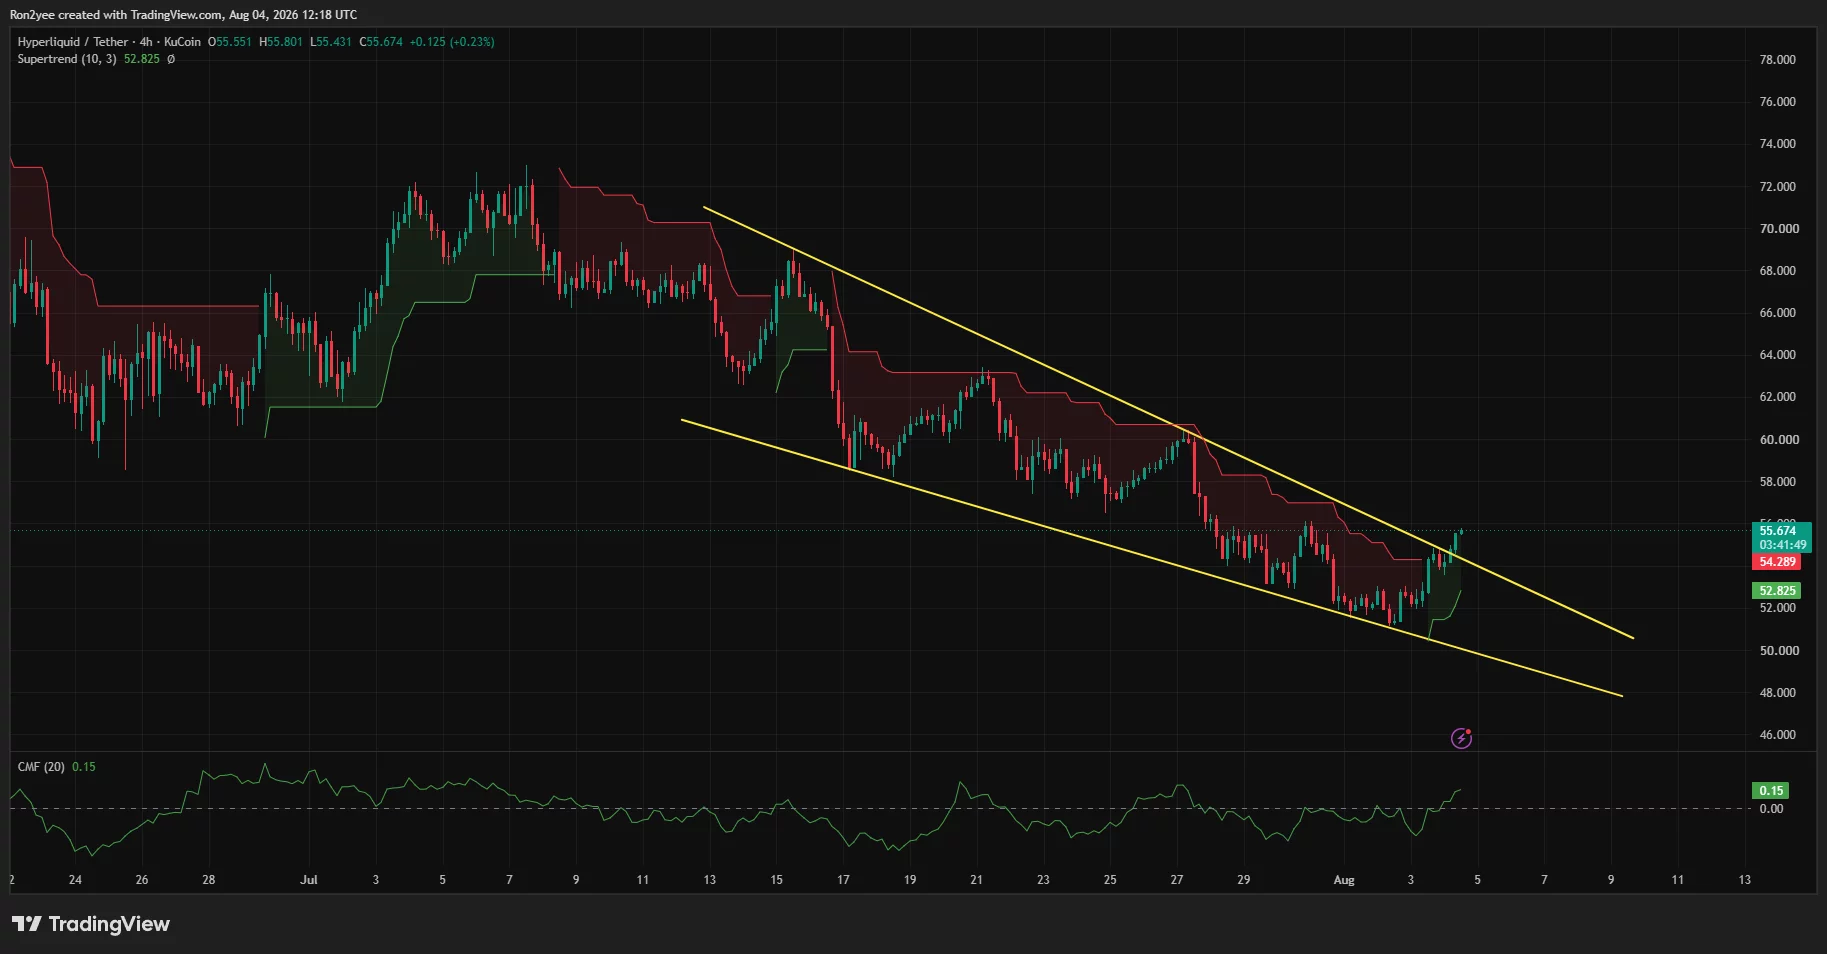
Buyers pushed the price through the channel’s upper boundary on Aug. 4, signaling that the short-term downtrend may be weakening. HYPE also reclaimed the 4-hour Supertrend level at $54.29, turning the indicator bullish for the first time since the latest leg lower.
Chaikin Money Flow rose to 0.15 alongside the breakout. A positive CMF reading indicates that buying pressure is exceeding selling pressure, adding support to the recovery rather than showing a rally driven entirely by thin trading conditions.
HYPE must now hold above the former channel resistance and the $54.00–$54.30 region. A drop back below that area would raise the risk of a failed breakout and another test of $52.83, the current Supertrend support.
Buybacks and platform demand support the move
The rebound comes as Hyperliquid’s fee-funded assistance fund continues purchasing HYPE on the open market. Under the protocol’s fee-routing structure, most platform revenue is directed toward token purchases, creating recurring demand when exchange activity rises.
Trailing gross revenue has reached approximately $1.34 billion. Hyperliquid also processed more than $30.44 million in large orders involving actively traded assets such as SKHX, MU, and SNDK over the latest session.
Demand may receive another longer-term boost from Hyperliquid’s expanded prediction and outcome market system. Deployers must lock at least 500,000 HYPE to create a permissionless public market, representing about $27.8 million at the current price.
That requirement could temporarily remove tokens from liquid circulation if adoption grows. However, it does not guarantee sustained price appreciation because the effect depends on the number of markets created and how long deployers maintain their locked positions.
The token’s recovery has also occurred while the wider altcoin market faces weak liquidity and regulatory uncertainty in the United States. Delays surrounding US crypto market-structure legislation may continue limiting risk appetite, particularly among traders waiting for clearer rules governing decentralized trading platforms.
HYPE price faces resistance near $58
Despite the 4-hour breakout, HYPE has not yet reversed its broader daily downtrend. The token remains below several major moving averages that could restrict further gains.
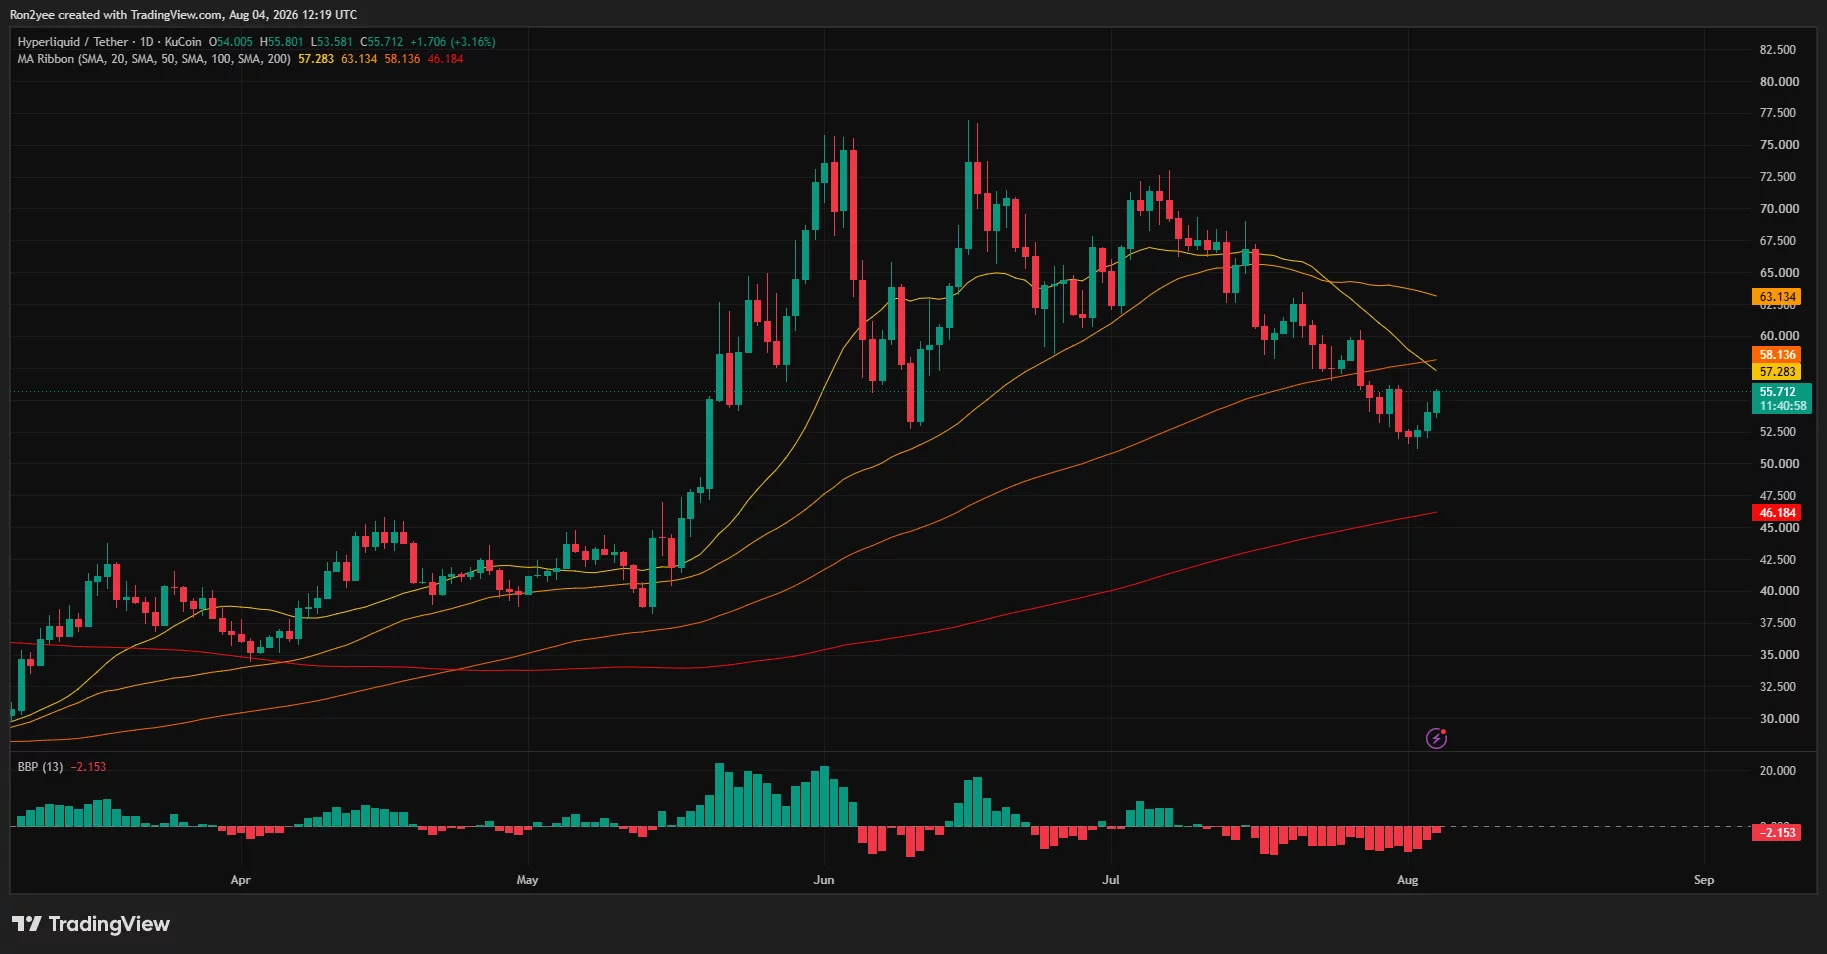
The 50-day simple moving average stands at $57.28, followed by the 100-day SMA at $58.14. These indicators create a narrow resistance zone between $57.28 and $58.14, making it the first major test for the current recovery.
A daily close above $58.14 would strengthen the bullish reversal case and expose the psychological $60 level. Beyond that, the 200-day moving average near $63.13 represents the next major target and a possible area of heavier profit-taking.
The BBP indicator remains negative at -2.153, showing that bearish pressure has not disappeared on the daily timeframe. However, its histogram has begun moving toward zero, indicating that sellers are gradually losing control.
If HYPE fails to clear the moving-average cluster, support sits at $54.30, followed by $52.83 and the recent low around $51. A decisive break below $51 would invalidate the channel breakout and expose $49.25. The daily 200-period EMA near $46.18 would provide deeper structural support.
Liquidation clusters could accelerate volatility
CoinGlass’ one-week liquidation heatmap shows substantial leveraged liquidity immediately above HYPE’s current price. The densest nearby clusters appear around $56.20–$56.40, with another major band close to $56.80–$57.00.

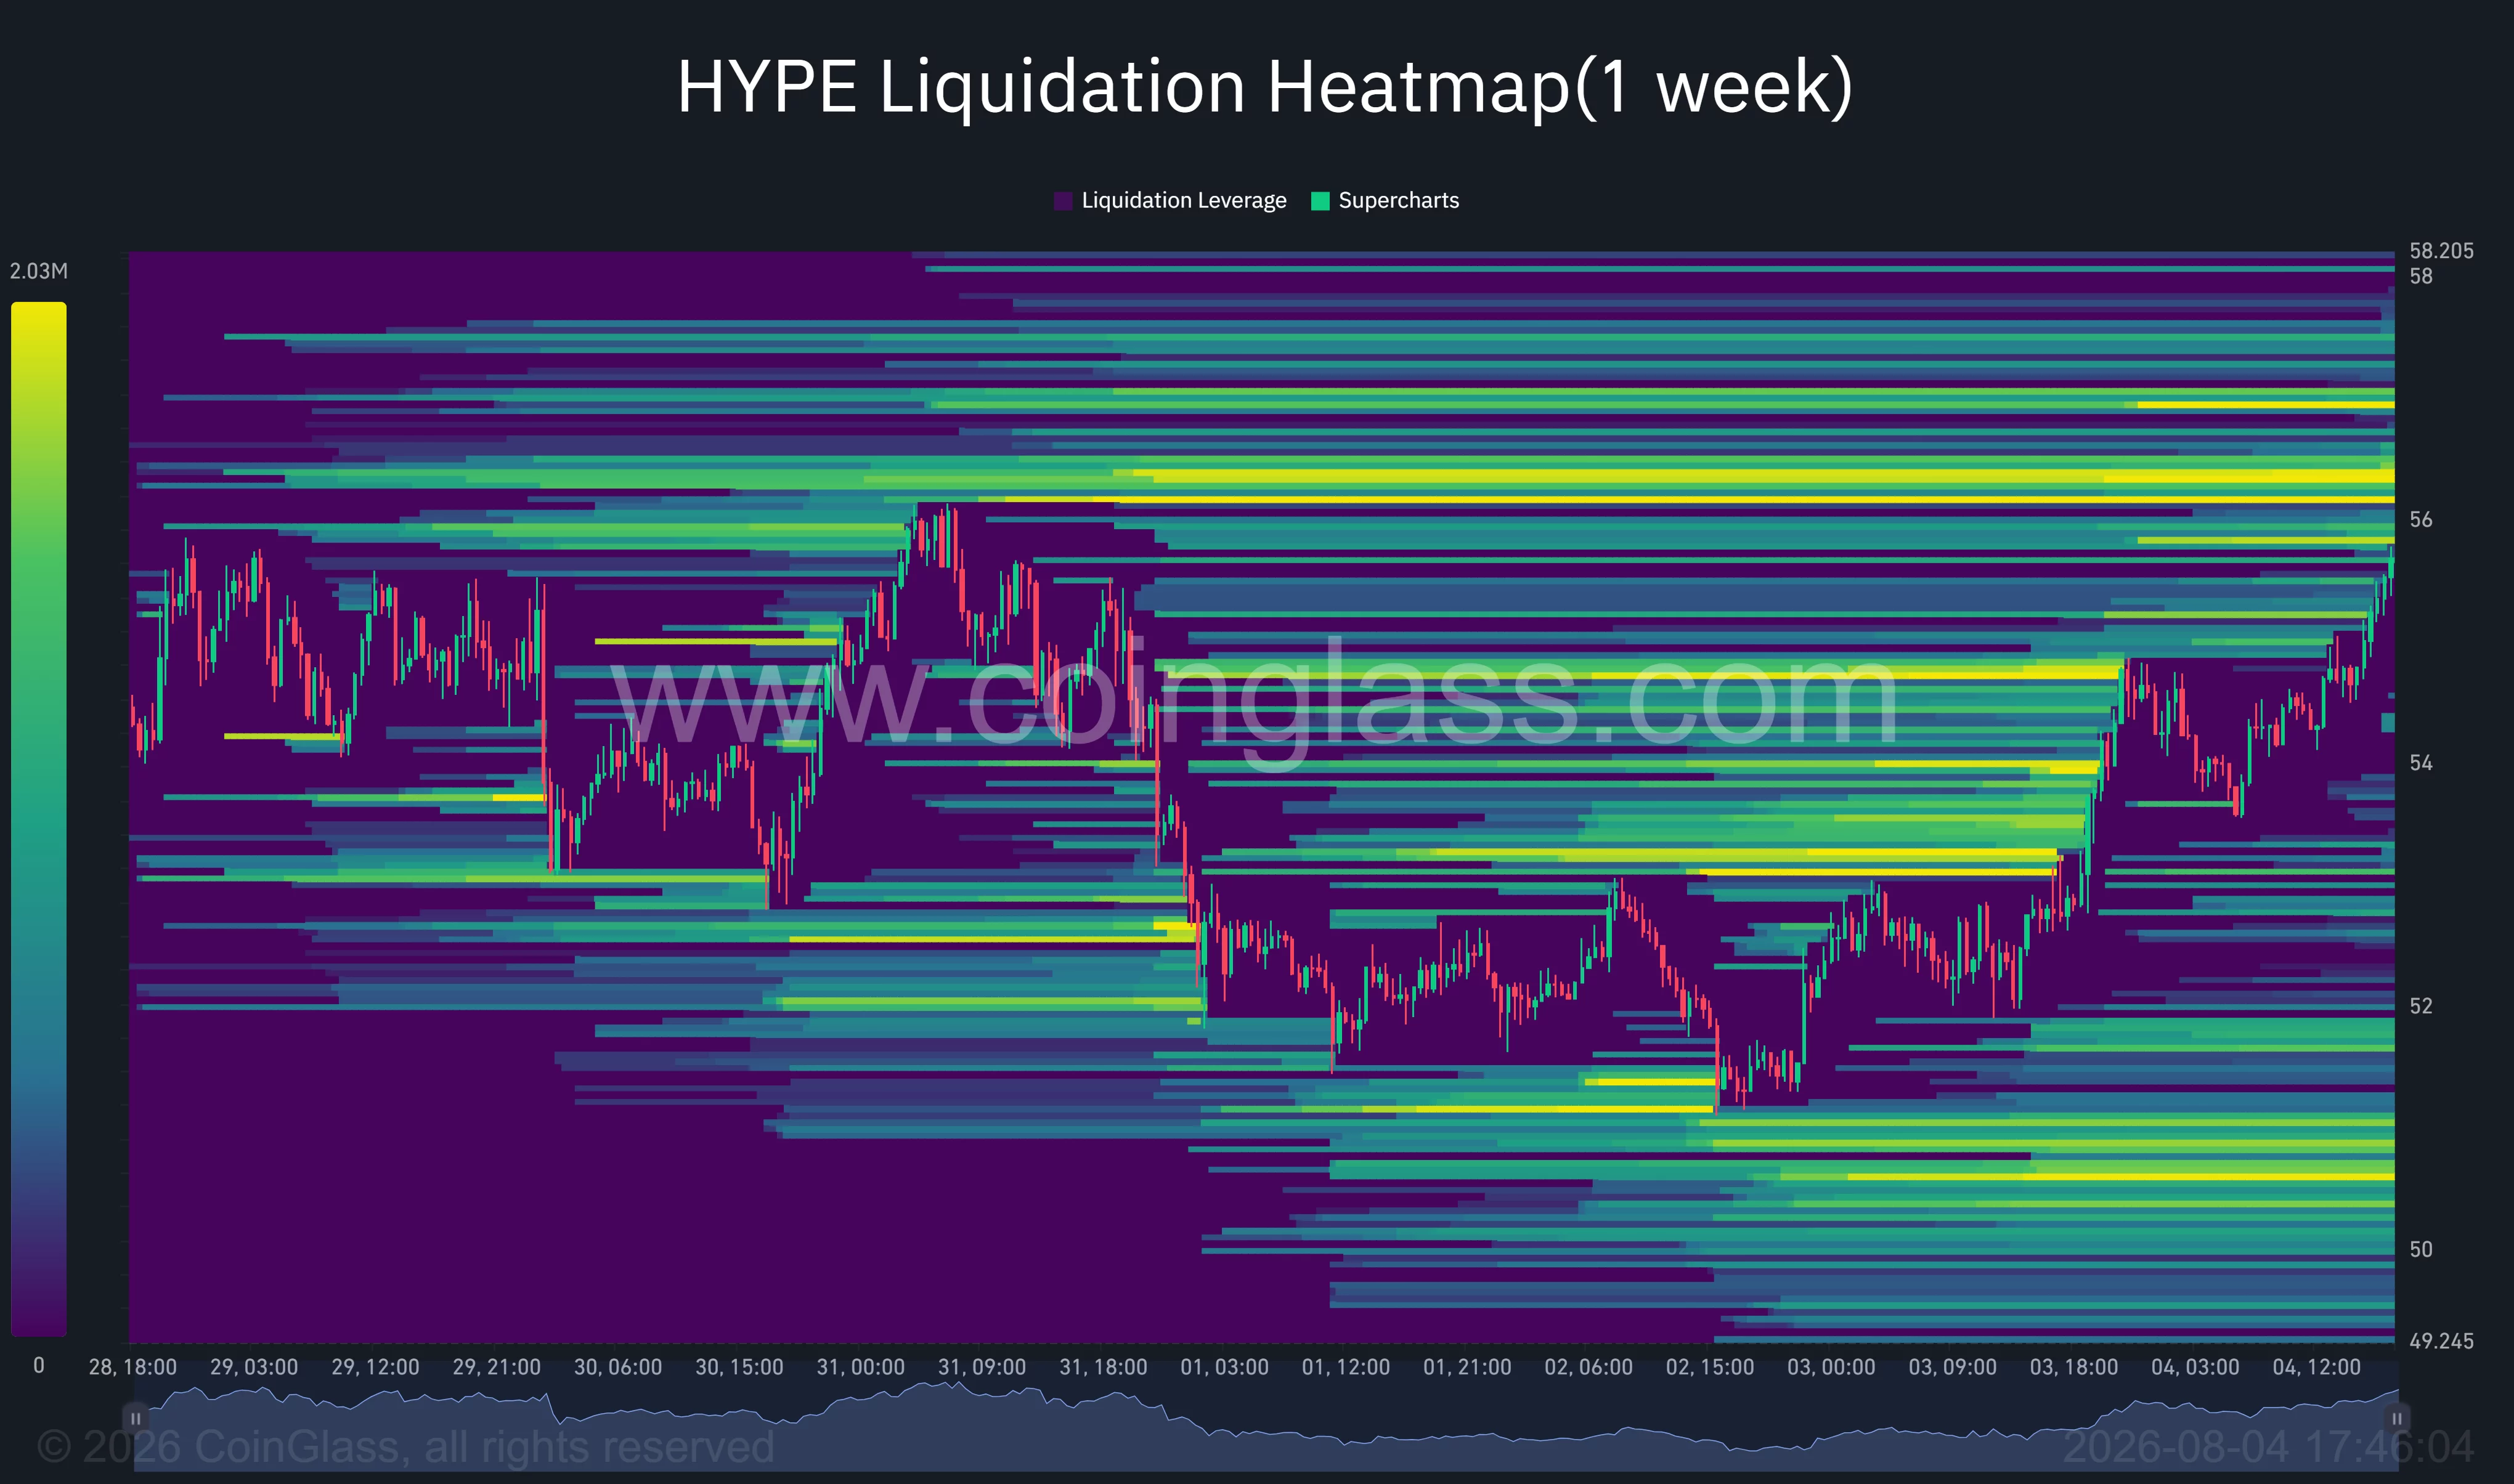
A move into those areas could force short positions to close, adding automatic buying pressure and carrying HYPE toward its daily moving averages. The liquidity distribution makes $57 a natural short-term magnet, although liquidation maps identify potential volatility zones rather than guaranteed targets.
Downside liquidity is visible around $53 and between $50.50 and $51.00. If the breakout loses momentum, leveraged long liquidations could accelerate a return to those levels.
Crypto trader Altcoin Sherpa described the latest two-day move as a possible attempt to reclaim the prior range low. The analyst remained cautious, noting that the recent bottom may have been shaped by prediction-market trading activity and that overhead supply remains a concern.
HYPE’s immediate outlook now depends on whether buyers can turn $54.30 into support and clear the $57.28–$58.14 resistance cluster. Holding above the breakout would favor a move toward $60, while a close below $52.83 would return control to sellers.
Disclosure: This article does not represent investment advice. The content and materials featured on this page are for educational purposes only.