


SKY price has climbed above $0.09 after recovering from its late-week pullback, with Binance’s daily chart showing a 10.71% advance to $0.09344 on Oct. 2.
Summary
- SKY price reached $0.09344 after gaining 10.71%, with the daily high standing at $0.09494.
- Daily Aroon readings showed upward trend strength, with price above all four tracked moving averages.
- The 4-hour chart showed a rising-channel breakout and positive momentum above the Supertrend support.
- CoinGlass showed nearby liquidation concentrations around $0.0947 above price and $0.091 below it.
The move cleared the token’s recent resistance zone as Galaxy Digital’s $100 million sUSDS treasury allocation remained a relevant institutional development for the Sky ecosystem.
Galaxy’s $100 million allocation adds institutional context
Sky Frontier Foundation announced on Sep. 23 that Galaxy Digital had added $100 million of sUSDS to its corporate treasury and approved the savings token as collateral across its institutional trading business. Galaxy also purchased SKY, although the announcement did not disclose the size of that purchase.
The partnership covers a lending business with an average loan book of $1.4 billion. According to the announcement, clients pledging sUSDS can continue earning the Sky Savings Rate on their position while using it to back a loan.
The release also reported that sUSDS supply reached $5.52 billion at the end of the second quarter, up 149% over a year. Sky recorded $107.35 million in gross revenue and a $33.29 million net surplus during that quarter.
A separate U.S. equities development brought attention to another large SKY holder. Benzinga reported that Stablecoin Development Corporation shares rose 115.29% to $3.38 during Sep. 29 trading, with volume exceeding 161 million shares against a 100-day average of 1.62 million.
The company’s SEC proxy filing disclosed holdings of approximately 2.315 billion SKY as of Sep. 13, representing about 10% of total supply. Its NYSE American listing connects a sizable SKY treasury position with the U.S. stock market.
SKY daily chart clears the spring resistance zone
TradingView’s Binance daily chart placed SKY at $0.09344, with a session high of $0.09494 and a low of $0.08231. Price had advanced beyond the recent September highs and the spring peak near $0.09, bringing the earlier wick around $0.095 into focus.

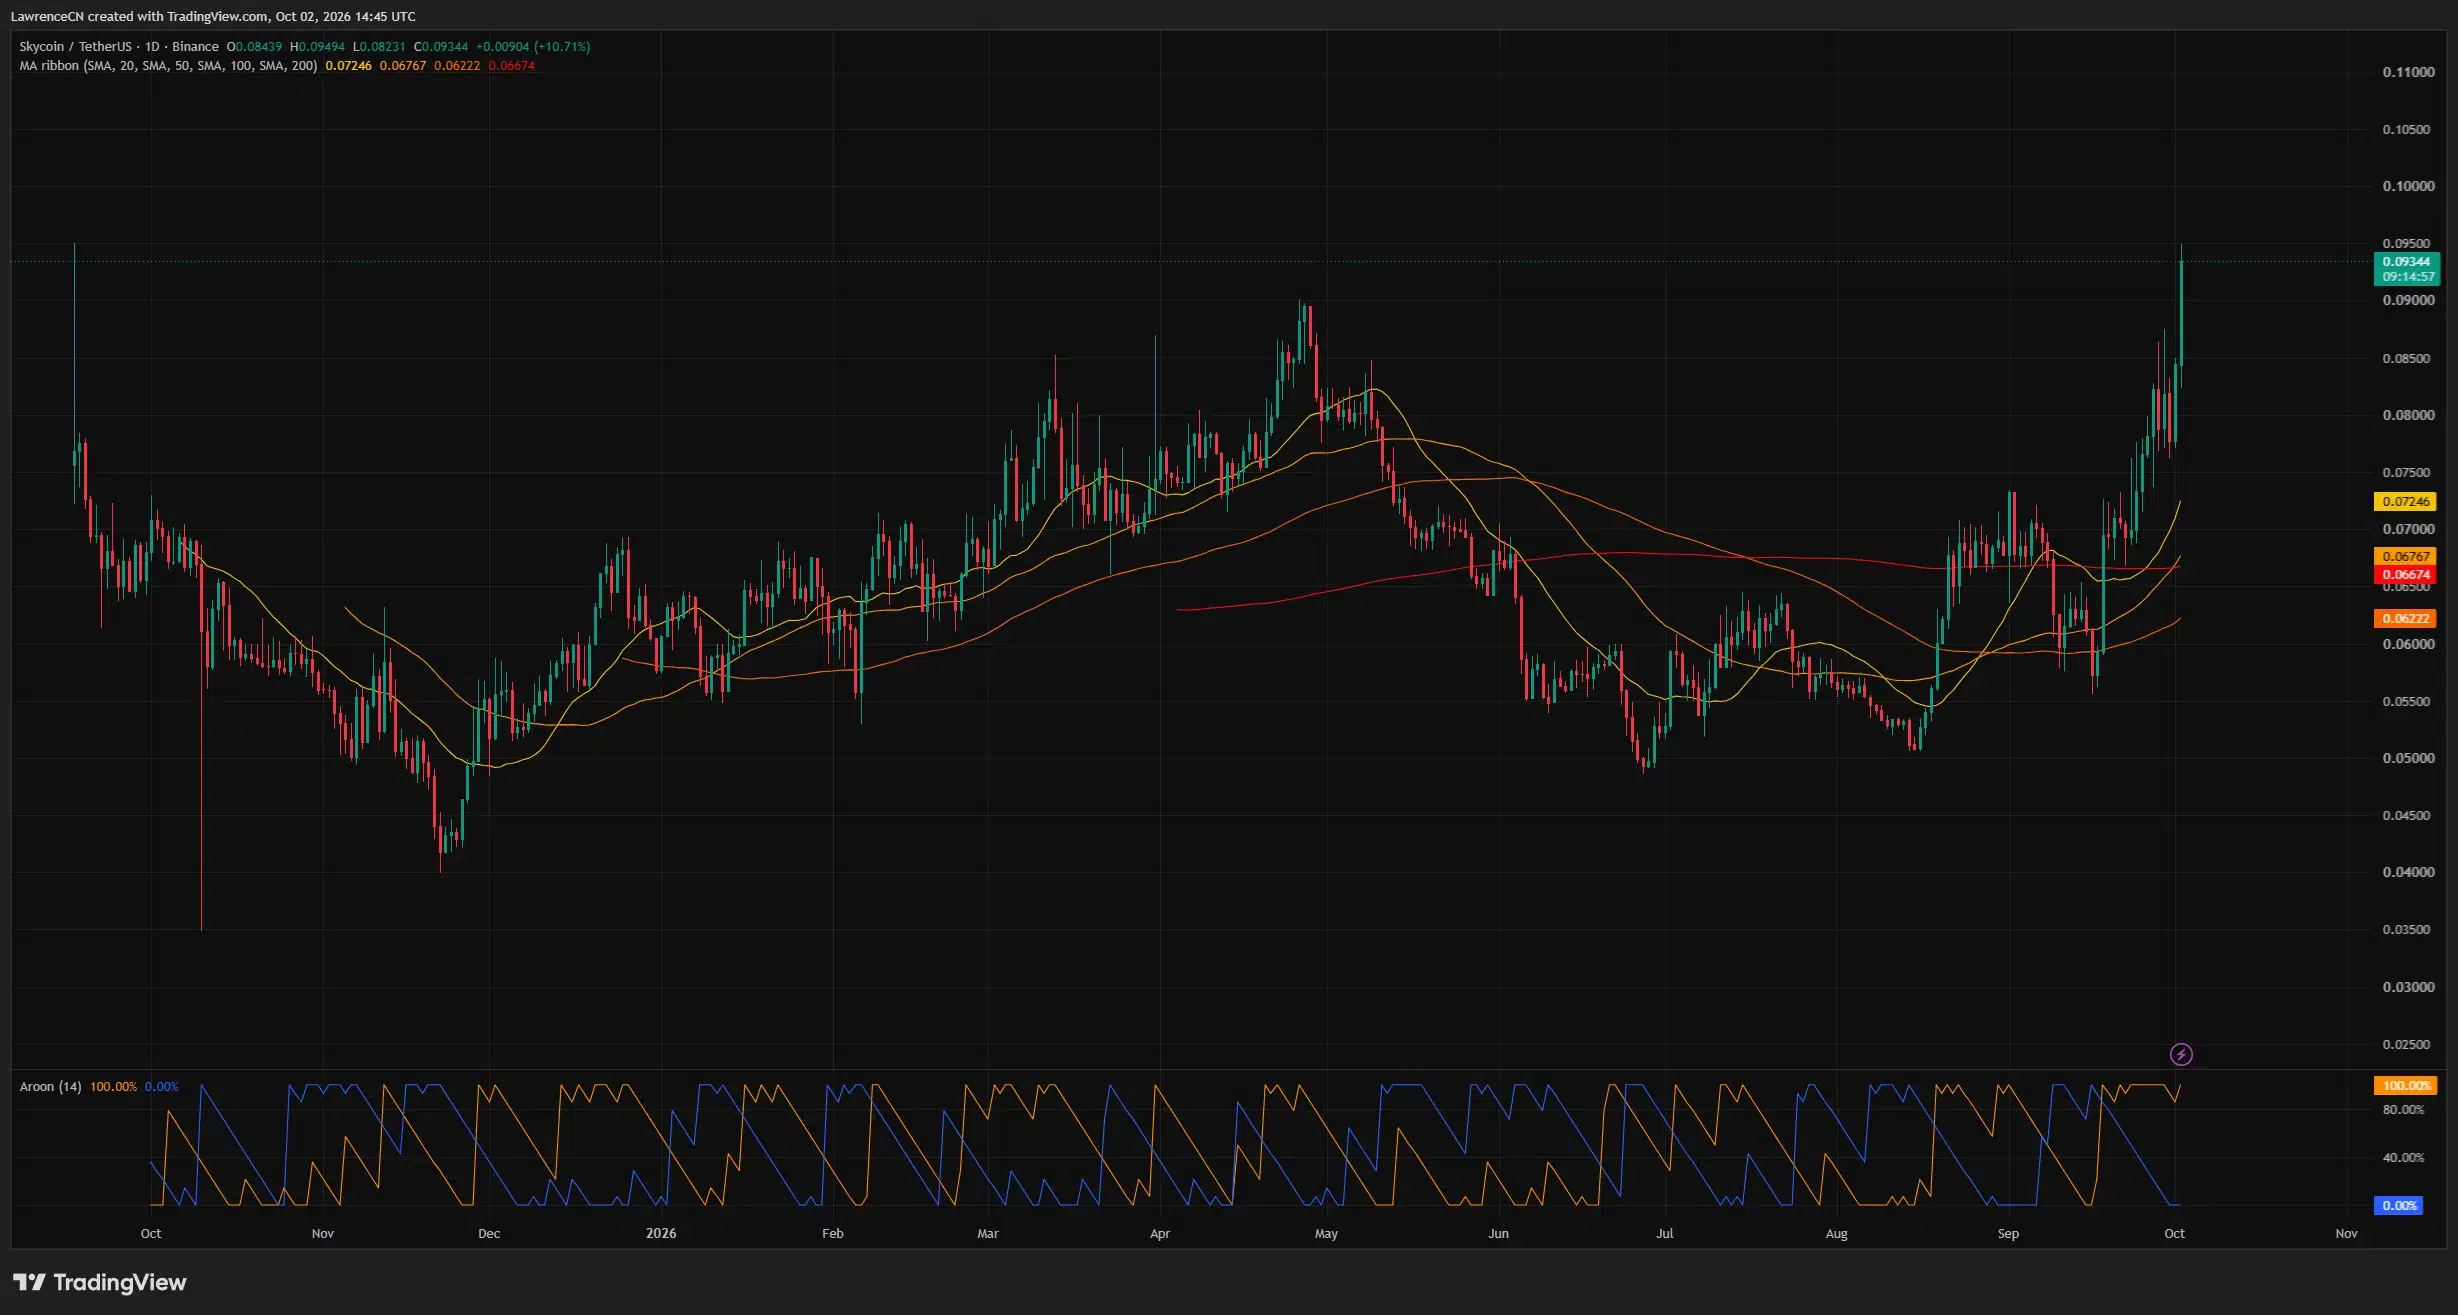
The daily structure showed a recovery from the August low near $0.051. Following a September rebound and a pullback toward $0.076, SKY resumed its climb and pushed through the $0.085–$0.09 area.
Price stood above the 20-day simple moving average at $0.07246, the 50-day average at $0.06767, the 100-day average at $0.06222, and the 200-day average at $0.06674. The 20-day average had turned higher and stood above the longer averages, supporting a bullish reading of the daily trend.
SKY traded roughly 29% above its 20-day average. That wide gap leaves room for a pullback even while the moving-average structure remains supportive.
The daily Aroon indicator showed Aroon Up at 100% and Aroon Down at 0%. The reading reflects a recent high within the indicator’s lookback period, while the period’s low sits further back.
For this daily setup, approximately $0.095 is the immediate resistance area. A sustained move above it would place the round-number $0.10 level next, while a retreat below $0.09 would put the recent breakout area around $0.085 back in view.
The 4-hour breakout challenges an earlier bearish setup
TradingView’s Binance 4-hour chart showed SKY at $0.09316 after price moved above the upper boundary of a rising channel. The channel had guided the recovery from mid-September, with successive higher lows beneath the advance.
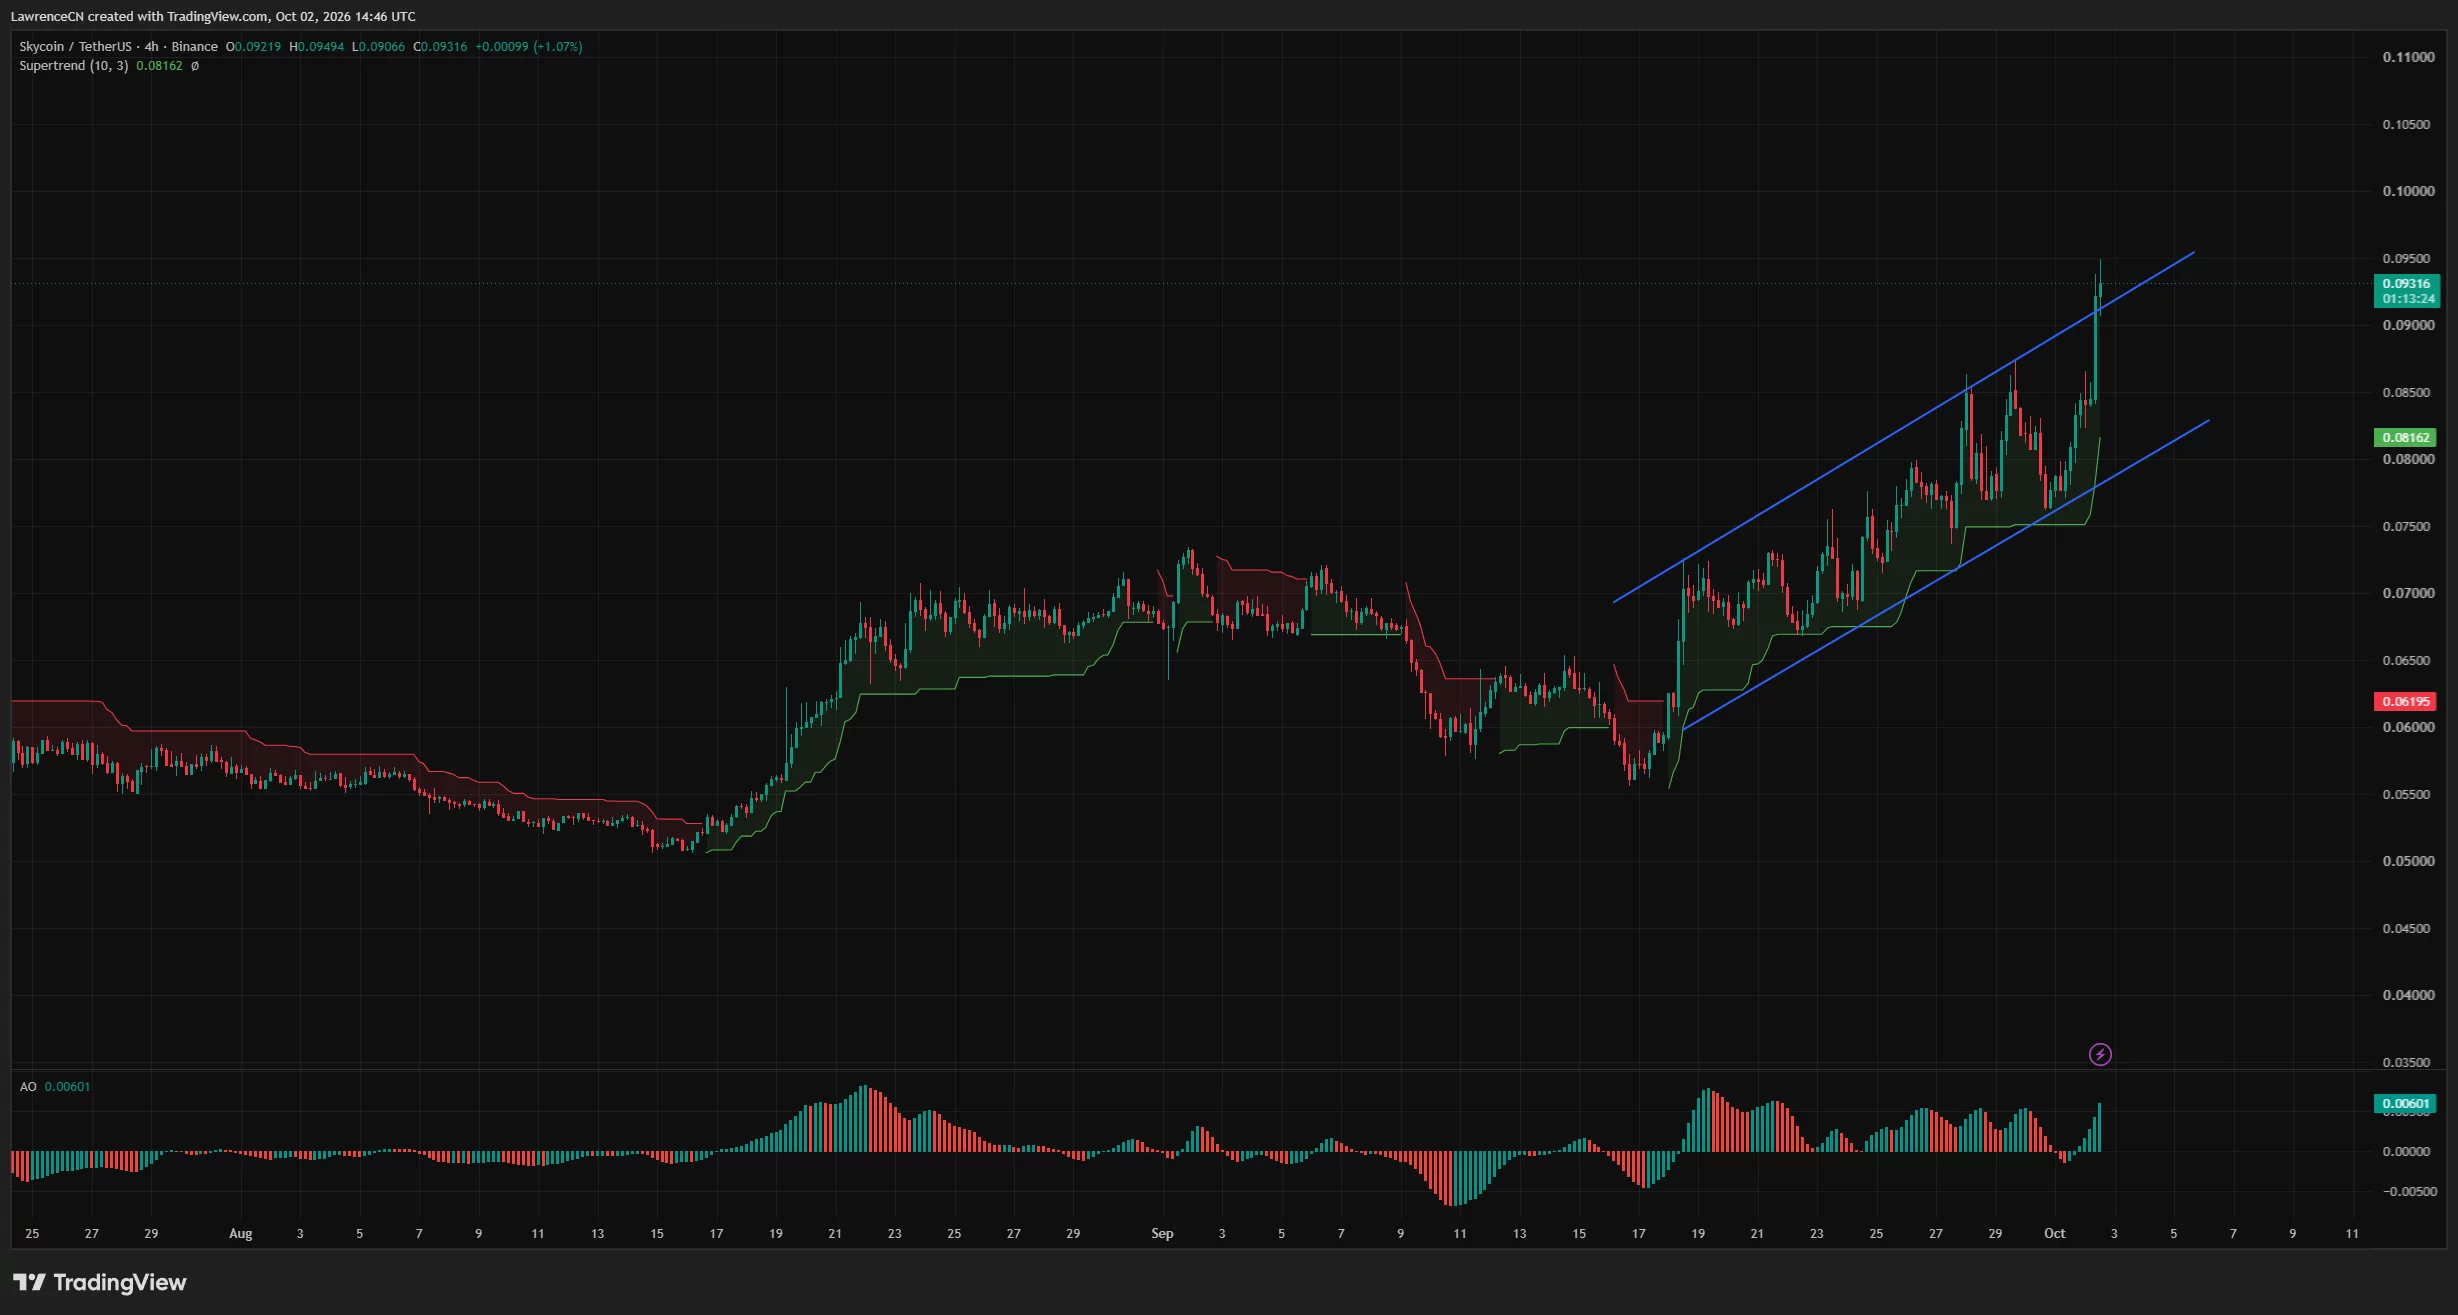
The latest push carried SKY beyond the channel ceiling near $0.091–$0.092 and toward $0.095. Holding above that boundary would support the breakout; falling back inside the channel would weaken the immediate upside setup.
The 4-hour Supertrend remained green at $0.08162, below the market price. That level provides a deeper trend reference beneath the nearer $0.09 area and the recent trading zone around $0.085.
The Awesome Oscillator registered 0.00601, with the latest green bars expanding above zero. The indicator showed strengthening upward momentum after a brief dip near its baseline.
Earlier on Oct. 2, trader Crypto With Gopal identified a possible double top around $0.088–$0.089, with a neckline near $0.076. The trader outlined a downside target around $0.064 if price broke below this neckline.
The later 4-hour chart showed SKY above both cited peaks rather than below the neckline, weakening that bearish setup. A renewed decline through $0.076 would be needed to bring the trader’s breakdown scenario back into focus.
Liquidation clusters sit near $0.095 and $0.091
CoinGlass’s 24-hour liquidation heatmap showed SKY climbing from below $0.08 toward $0.095, followed by a retreat and rebound toward $0.0935. The price path included several sharp advances through overhead liquidation bands.

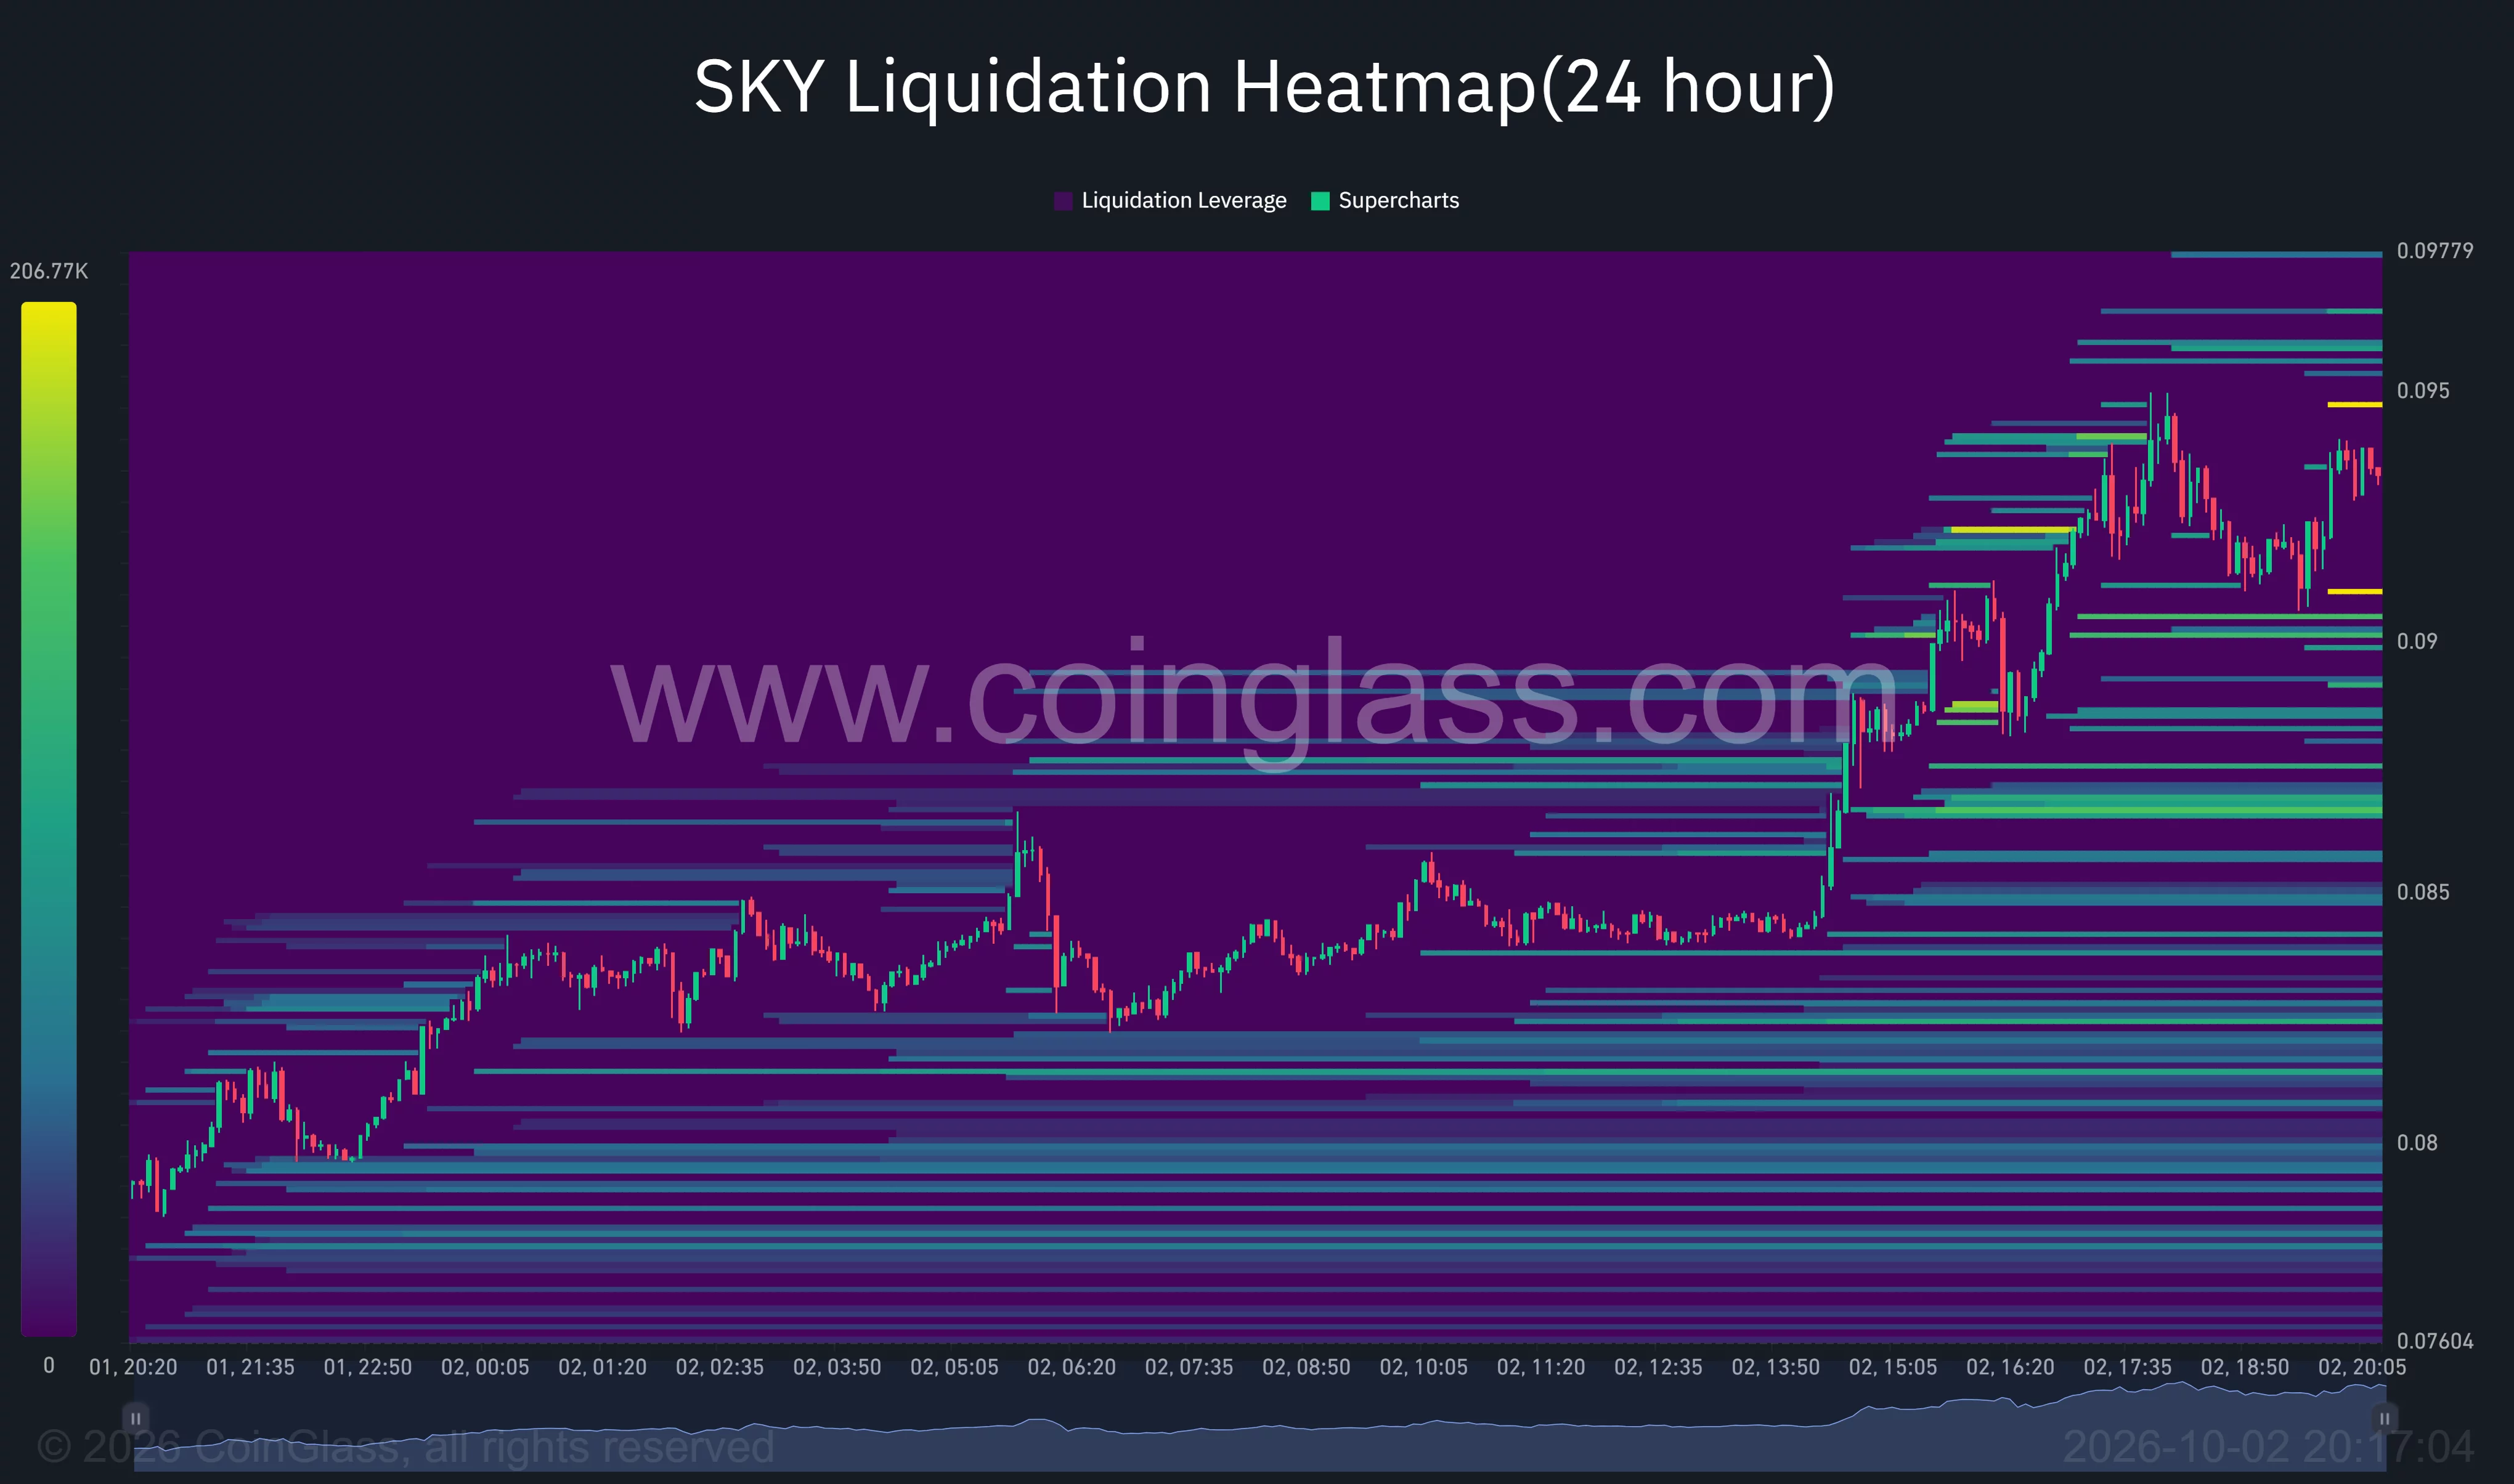
At the right edge of the heatmap, a bright concentration sat around $0.0947, close to the session high. Further bands appeared around $0.096–$0.0978, marking additional areas of estimated liquidation exposure above the market.
Below price, another bright band appeared near $0.091, followed by concentrations around $0.090 and $0.088–$0.089. A broader cluster remained near $0.0865–$0.087.
Those bands mark estimated levels where leveraged positions could face forced closure if price reaches them. An advance through $0.0947 could expose nearby short positions, while a decline toward $0.091 could pressure leveraged longs.
The nearest heatmap concentrations therefore bracketed SKY’s rebound around $0.0935: approximately $0.0947 overhead and $0.091 below, with wider liquidation bands extending beyond both levels.
Disclosure: This article does not represent investment advice. The content and materials featured on this page are for educational purposes only.