Solana’s price retreated for two consecutive days on Monday, reaching its lowest point since January 3, as risk-off sentiment spread across financial markets after Donald Trump threatened new tariffs on key NATO members.
Summary
- Solana price has formed a cup-and-handle pattern on the daily chart.
- The ongoing decline is part of the formation of the handle section.
- Third-party data shows that Solana transactions are soaring.
Solana (SOL) token retreated to a low of $130, down by 10% from its highest point this year. This retreat brought its market capitalization to $80 billion, making it the sixth-biggest cryptocurrency in the industry.
On the positive side, Solana has strong technicals and fundamentals that may help support its recovery in the near term. For example, Nansen data shows that it is the most actively used blockchain in the crypto industry.
It handled over 1.86 billion transactions in the last 30 days, a 1.8% increase. Its transaction costs were much higher than those of other networks like Ethereum, BNB Chain, Tron, and Polygon combined.
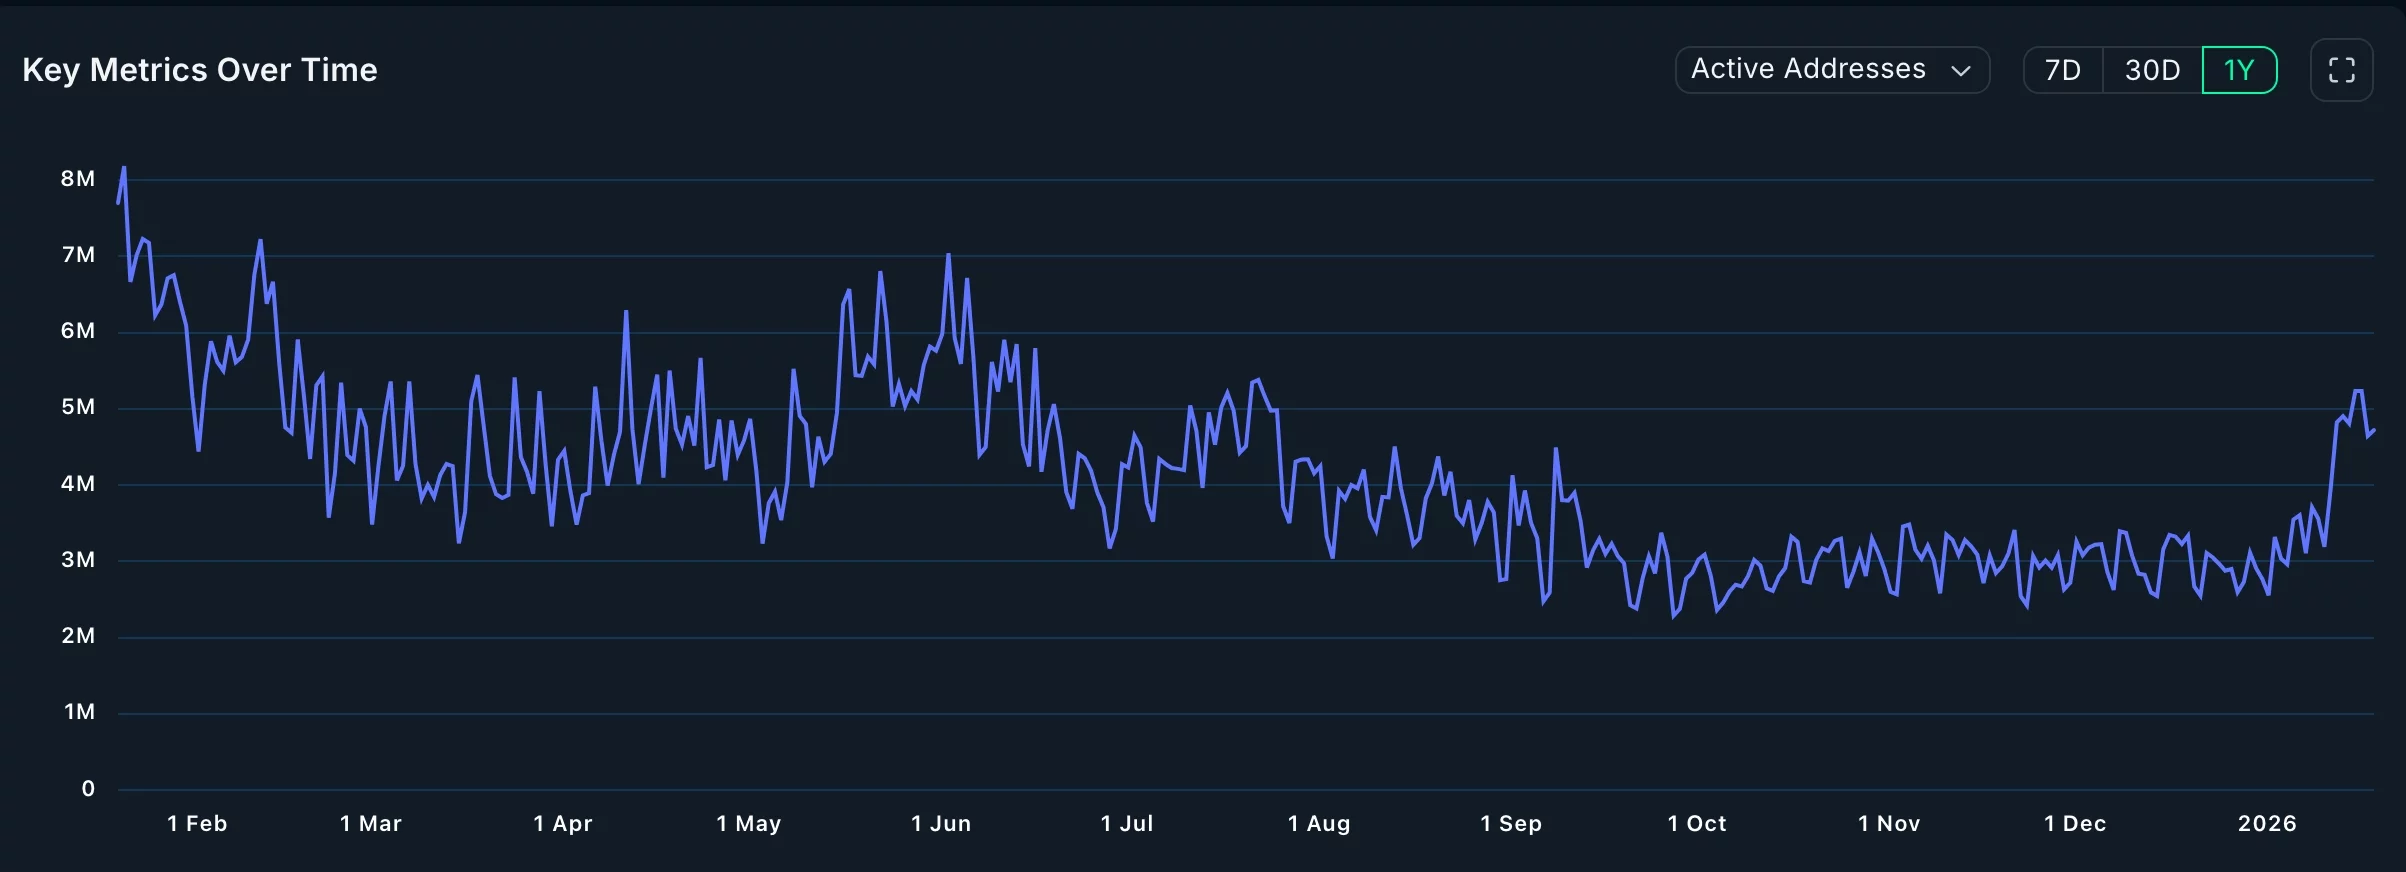
Solana also had over 72 million active addresses in this period, an 18% increase. Its active addresses were much higher than those of other popular chains.
Additionally, Solana’s DEX volume jumped to over $114 billion in the last 30 days, much higher than Ethereum, Base, and BSC Chain combined. All these metrics led to a surge in network fees, which rose to $18.5 million.
Solana is also becoming a popular chain in areas other than meme coins. For example, it has become a major player in the tokenized stocks industry, with the total value locked rising to over $1.6 billion.
This growth will likely accelerate after the network launches the Alpenglow upgrade later this quarter. This upgrade will introduce new capabilities and higher speeds.
Meanwhile, spot Solana ETFs have continued their inflows this year. They have added over $97 milion in inflows in January, with the total assets rising to $1.2 billion.
Solana price technical analysis
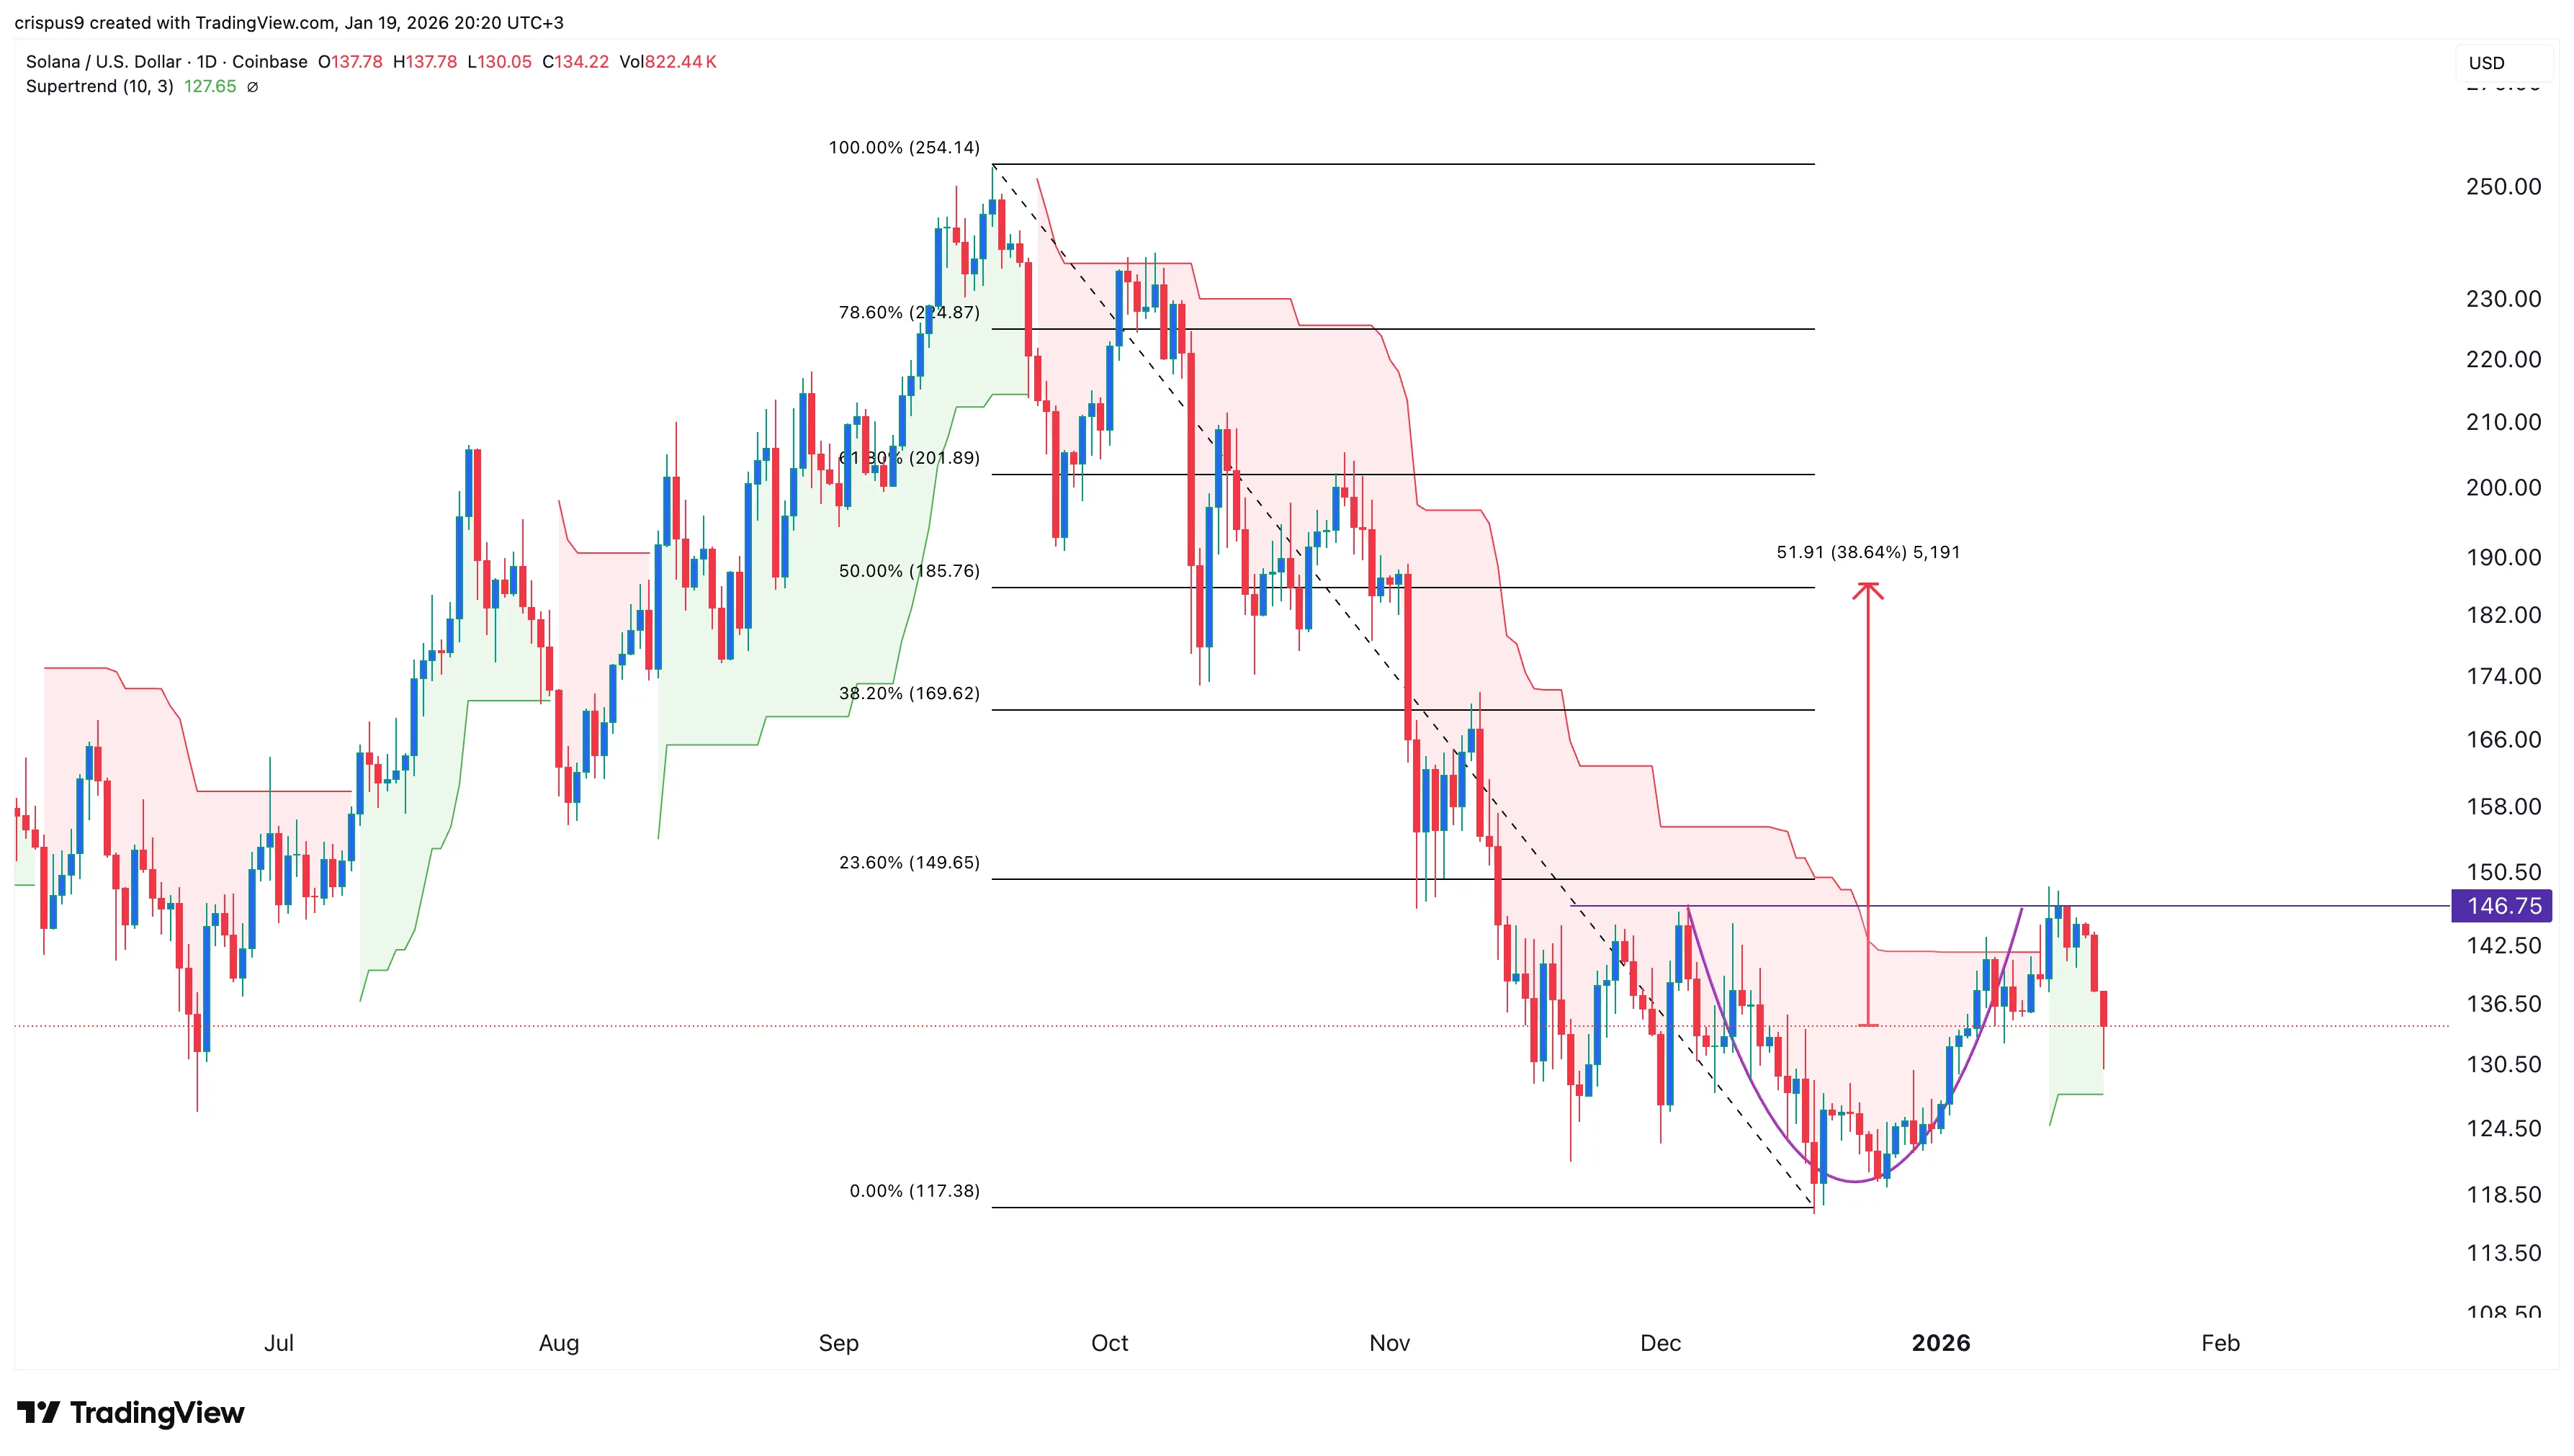
The daily timeframe chart shows that the Solana token pulled back sharply after hitting the key resistance level at $146, which was a few points below the 23.6% Fibonacci Retracement level.
This retreat is likely part of the handle section of the cup-and-handle pattern, a common bullish continuation pattern. The coin remains in the green, a sign that the rebound remains intact.
Therefore, the coin will likely rebound to the 50% Fibonacci Retracement level at $185, a 40% increase from the current level.